

Question: Answer the question: Select an appropriate way to display raw data values in each of the following scenarios. Paired or repeated measures of continuous quantities

Answer the question:
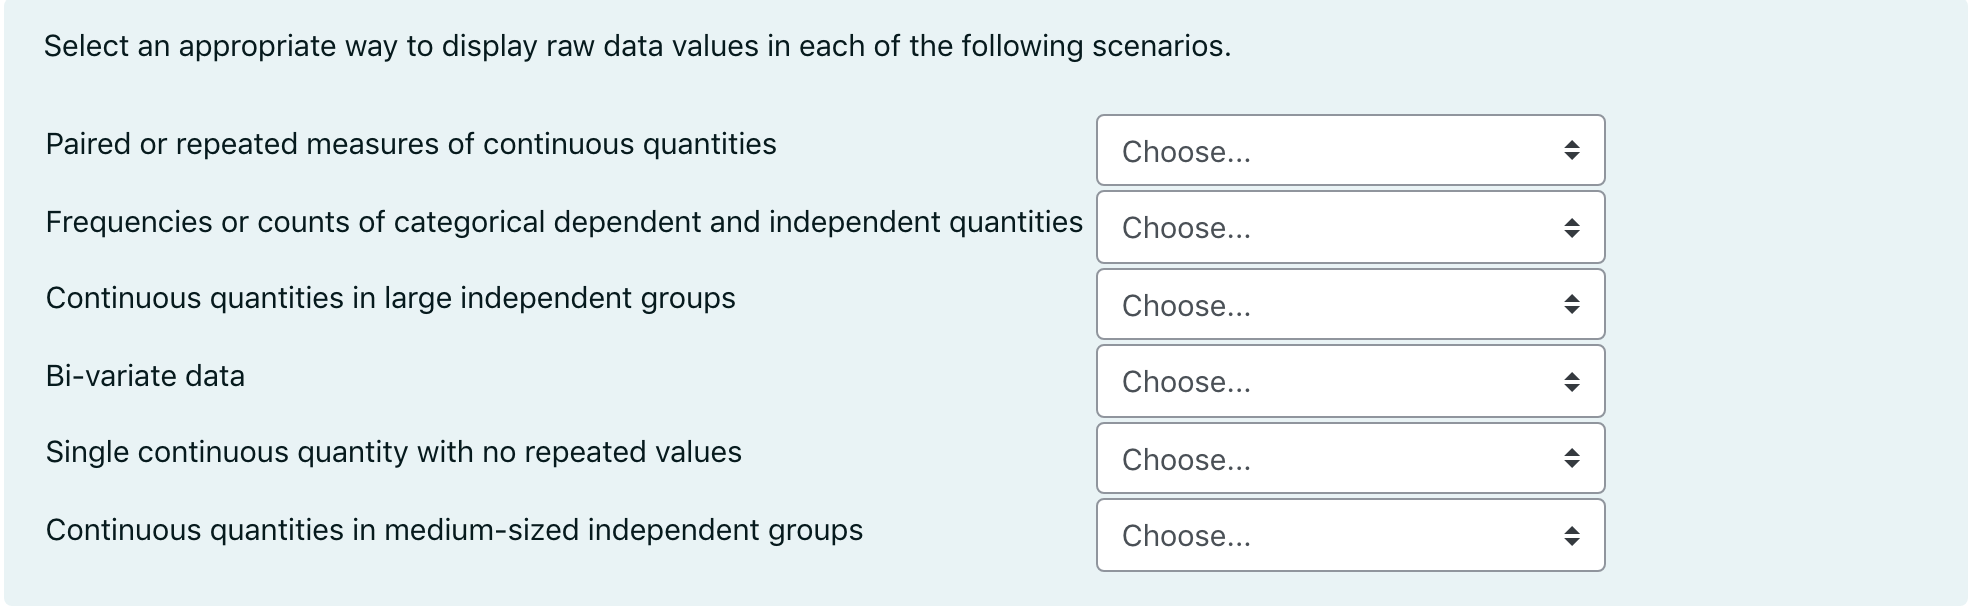
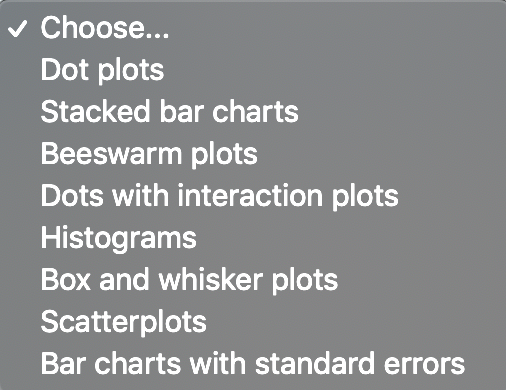
Select an appropriate way to display raw data values in each of the following scenarios. Paired or repeated measures of continuous quantities Frequencies or counts of categorical dependent and independent quantities Continuous quantities in large independent groups Bi-variate data Single continuous quantity with no repeated values Continuous quantities in mediumsized independent groups Choose... 0 Choose... 0 Choose... 0 Choose... 0 Choose... 0 Choose... 0 Choose... Dot plots Stacked bar charts Beeswarm plots Dots with interaction plots Histograms Box and whisker plots Scatterplots Bar charts with standard errors
Step by Step Solution
There are 3 Steps involved in it
1 Expert Approved Answer
Step: 1 Unlock

Question Has Been Solved by an Expert!
Get step-by-step solutions from verified subject matter experts
Step: 2 Unlock
Step: 3 Unlock