

Question: Answer the questions in the screenshot below. Please write legibly and explain your answer choice. Thank you. 6. The following boxplot summarizes the birth weights
Answer the questions in the screenshot below. Please write legibly and explain your answer choice. Thank you.
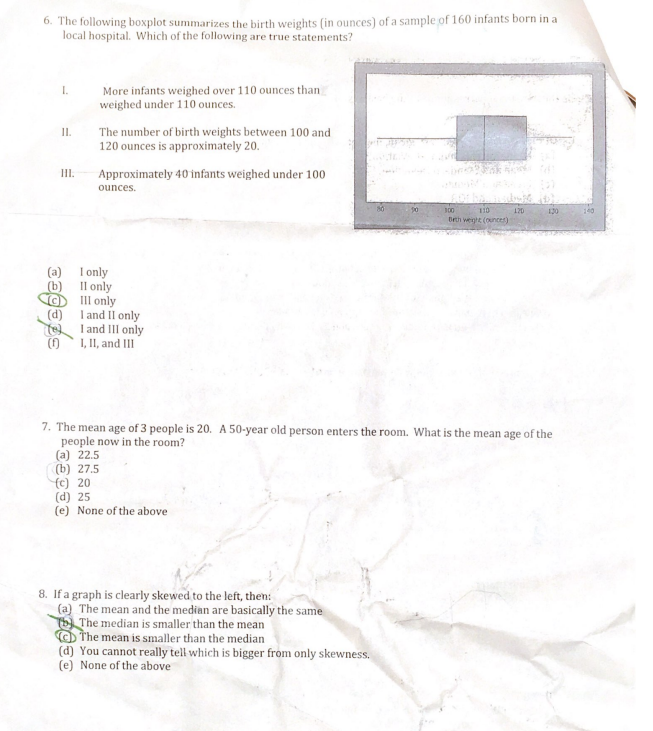
6. The following boxplot summarizes the birth weights (in ounces) of a sample of 160 infants born in a local hospital. Which of the following are true statements? I. More infants weighed over 110 ounces than weighed under 110 ounces. II. The number of birth weights between 100 and 120 ounces is approximately 20. HI. Approximately 40 infants weighed under 100 ounces. 110 Orth wants (ounce) I only II only III only I and II only I and III only I, II, and III 7. The mean age of 3 people is 20. A 50-year old person enters the room. What is the mean age of the people now in the room? (a) 22.5 (b) 27.5 (c) 20 (d) 25 (e) None of the above 8. If a graph is clearly skewed to the left, then: (@) The mean and the median are basically the same [by The median is smaller than the mean (cD The mean is smaller than the median (d) You cannot really tell which is bigger from only skewness. (e) None of the above
Step by Step Solution
There are 3 Steps involved in it

Get step-by-step solutions from verified subject matter experts