

Question: Answer the questions using a TI 83/84 calculator 1. At a 5% level, test the claim that the mean income of people in the population
Answer the questions using a TI 83/84 calculator
1. At a 5% level, test the claim that the mean income of people in the population is greater than $50k. What test should be use? Attach results from the technology.According to the results, is there enough evidence to support the claim? Use a graph to check the condition that the income don't have outliers.
2. At a 5% level, test the claim that males and females in the population don't have the same mean age.What test should be use? Attach results from the technology. According to the results, is there enough evidence to support the claim? Specify if you pool the variance or not.Use graphs to check the condition that both distributions for males and females ages follow an approximate normal distrbution.
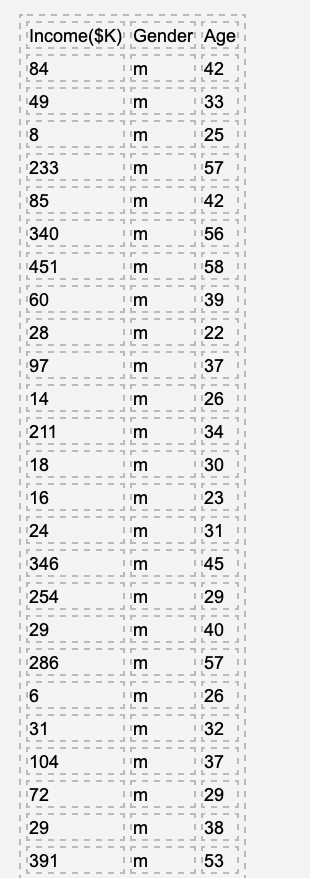
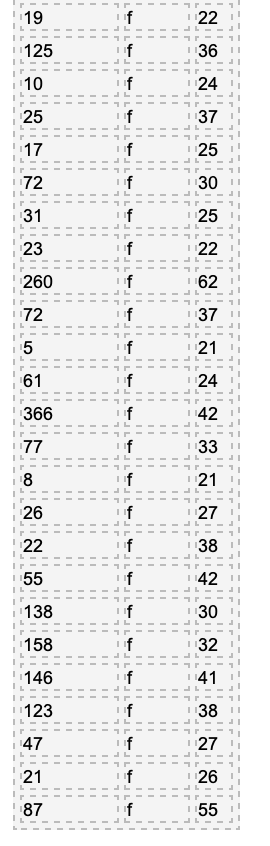
7 r Income($K) Gender Age - - 84 1 142 149 1 133 L - Ir= 18 125 r 233 1 157 85 1 142 L - 1340 56 Ir - - 1 451 158 60 Im 1 139 28 1 122 L 7r - 97 137 1 14 26 L IL r 211 134 L 18 30 16 Im 123 L - - Ir = 1 124 31 IL - 346 45 L 254 1 129 29 140 JL - L 286 57 6 26 31 Im 132 J L 104 I'm 137 IL - - 172 29 L IL - r 29 38 391 153 L19 122 I I 125 1 136 L 10 1 124 JL 25 1 137 117 125 IL - L 172 30 L 31 25 JL 23 1 22 260 162 L L 172 137 IL 5 121 L 61 124 JL 366 1 142 L L 177 33 L 8 121 L 26 127 22 138 = L Ir = 55 142 L 138 130 L 158 132 146 141 L 123 138 L 1 47 1 127 L 21 26 L 187 155 L L
Step by Step Solution
There are 3 Steps involved in it

Get step-by-step solutions from verified subject matter experts