

Question: Answer these numericals a. Consider the data in Exercise 20. Suppose that instead of the least squares line passing through the points (X1, ),), .
Answer these numericals
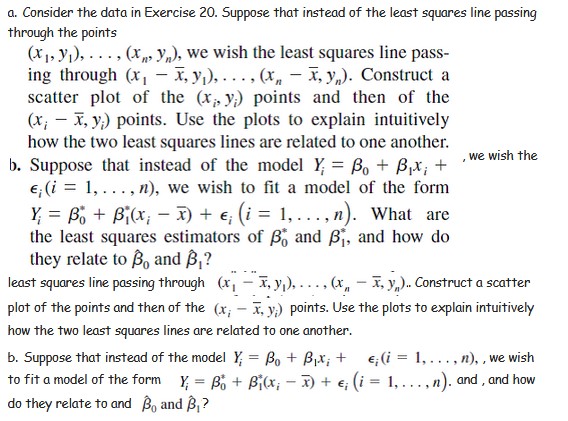
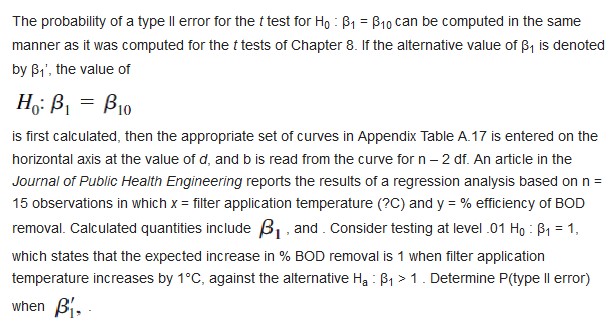
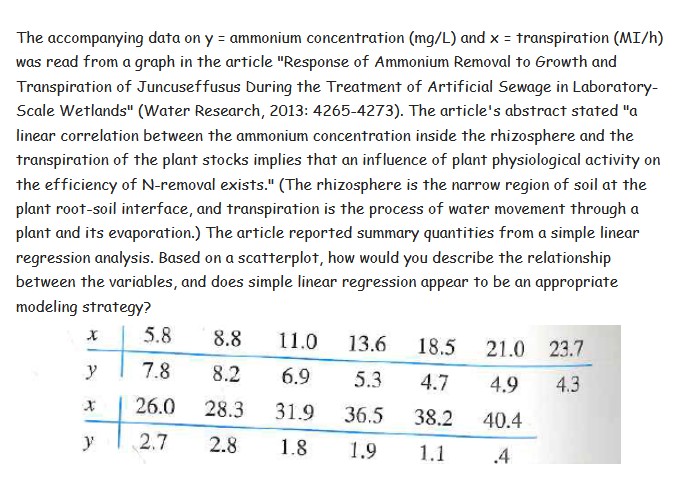

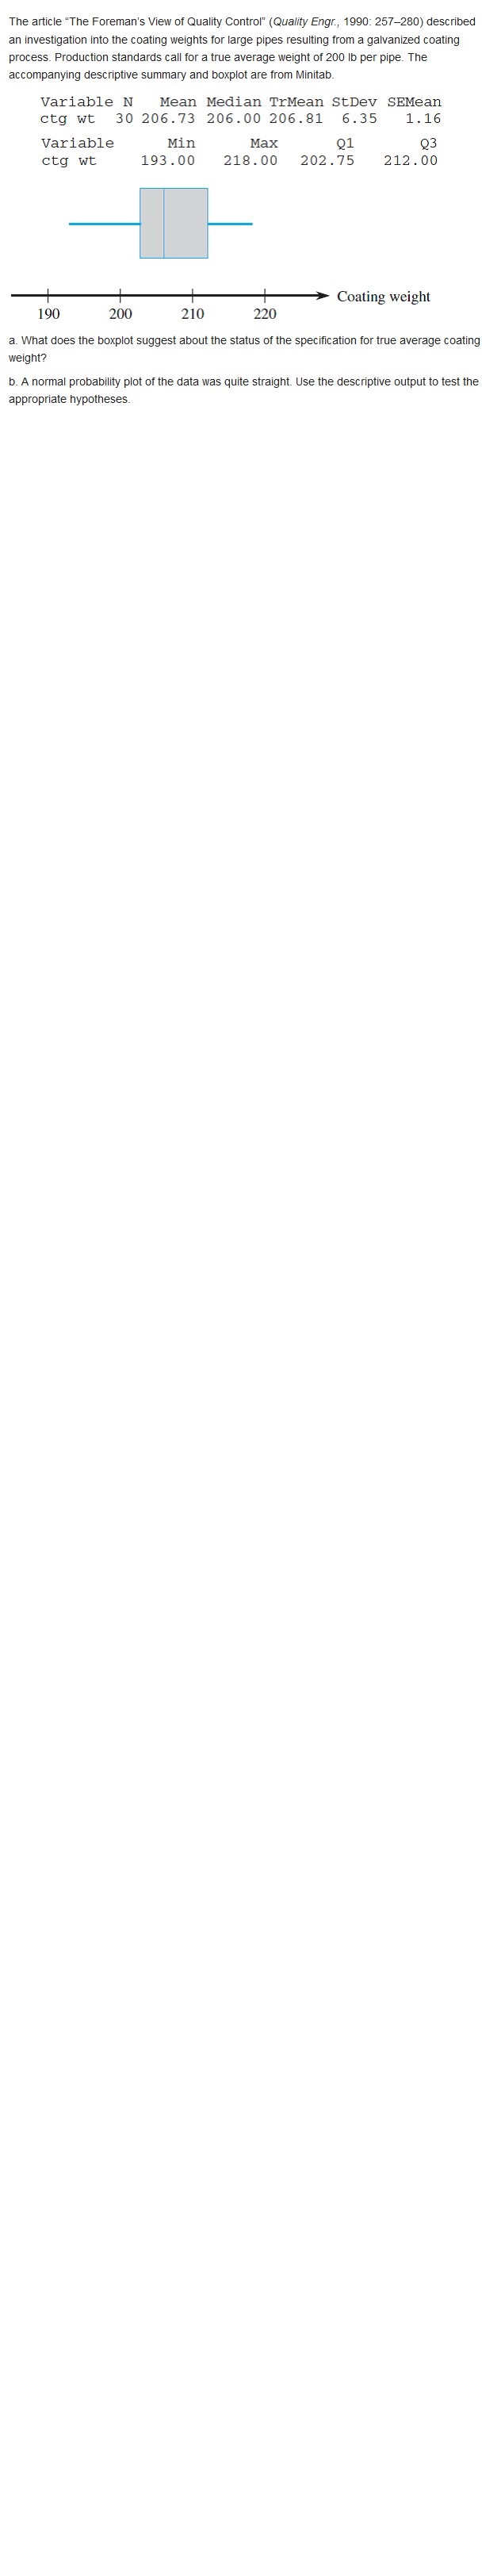
a. Consider the data in Exercise 20. Suppose that instead of the least squares line passing through the points (X1, ),), . . .. (x, , y,), we wish the least squares line pass- ing through (x, - x, y,), . . . . (X, - X, y,,). Construct a scatter plot of the (x;, y,) points and then of the (x; - x, y.) points. Use the plots to explain intuitively how the two least squares lines are related to one another. b. Suppose that instead of the model Y, = Bo + Bix; + . we wish the E, (i = 1, . . ., n), we wish to fit a model of the form Y = Bo + Bj (x; - x) + e; (i = 1,..., n). What are the least squares estimators of B; and B;, and how do they relate to Bo and B,? least squares line passing through (x, - X, y,). .... (x,, - X, y,).. Construct a scatter plot of the points and then of the (x; - X, y.) points. Use the plots to explain intuitively how the two least squares lines are related to one another. b. Suppose that instead of the model Y, = Bo + Bix; + e; (i = 1, . ... n), , we wish to fit a model of the form Y = B; + Bj(x, - D) + e; (i = 1, .... "). and , and how do they relate to and Bo and B,?The probability of a type ll error for the t test for Ho : 1 = $10 can be computed in the same manner as it was computed for the t tests of Chapter 8. If the alternative value of B, is denoted by B1', the value of Ho: B1 = Bio is first calculated, then the appropriate set of curves in Appendix Table A.17 is entered on the horizontal axis at the value of d, and b is read from the curve for n - 2 df. An article in the Journal of Public Health Engineering reports the results of a regression analysis based on n = 15 observations in which x = filter application temperature (?C) and y = % efficiency of BOD removal. Calculated quantities include 3, and . Consider testing at level .01 Ho : B1 = 1, which states that the expected increase in % BOD removal is 1 when filter application temperature increases by 1'C, against the alternative Ha : B, > 1 . Determine P(type ll error) whenThe accompanying data on y = ammonium concentration {mgfL} and x = Transpiration {MDl h) was read from a graph in the article "Response of Ammonium Removal To Growth and Transpiration of Juncuseffusus During The Treatment of Artificial Sewage in Laboratory .Scale Wetlands" [Water Research! 2013: 426542?3]. The article's abstract stated IIa linear correlation between the ammonium concentration inside the rhizosphere and The transpiration of The plant stocks implies That an influence of plant physiological activity on the efficiency of Hremoval exists.\" {The rhizosphere is the narrow region of soil at the plant rootsoil interface, and Transpiration is The process of Illvater movement Through a plant and its evaporation.) The article reported summary quantities from a simple linear regression analysis. Based on a scatterplot, how would you describe The relationship between The variables, and does simple linear regression appear To be an appropriate modeling strategy? 3.3 11.0 13.6 13.5 21.0 23.? y 7.3 3.2 6.9 5.3 4.? 4.9 4.3 J: '26.!) 28.3 31-9 36.5 33.2 40.4 )1 2.7 2.3 1.8 1.9 1.1 .4 Identify the statistical population, sample, and variable of interest in each of the following situations: (a) To learn about starting salaries for engineers graduating from a Midwestern university, twenty graduating seniors are asked to report their starting salary. (b) Fifty computer memory chips were selected from the thousand manufactured that day. The computer memory chips were tested, and 5 were found to be defective. (c) Tensile strength was measured on 20 specimens made of a new plastic material. The intent is to learn about the tensile strengths for all specimens that could conceivably be manufactured with the new plastic material.The article "The Foreman's View of Quality Control" (Quality Engr., 1990: 257-280) described an investigation into the coating weights for large pipes resulting from a galvanized coating process. Production standards call for a true average weight of 200 lb per pipe. The accompanying descriptive summary and boxplot are from Minitab Variable N Mean Median TrMean StDev SEMean ctg wt 30 206.73 206.00 206.81 6.35 1 . 16 Variable Min Max 03 ctg wt 193 . 00 218.00 202.75 212. 00 Coating weight 190 200 210 220 a. What does the boxplot suggest about the status of the specification for true average coating weight? b. A normal probability plot of the data was quite straight. Use the descriptive output to test the appropriate hypotheses.In Exercise 55, suppose the experimenter had believed before collecting the data that the value of or was approximately .30. If the experimenter wished the probability of a type II error to be .05 when p = 3.00, was a sample size 50 unnecessarily large? Reference Exercise 65, A sample of50 lenses used in eyeglasses yields a sample mean thickness of3.05 mm and a sample standard deviation of .34 mm. The desired true average thickness of such lenses is 3.20 mm. Does the data strongly suggest that the true average thickness of such lenses is something other than what is desired? Test using (I = .05
Step by Step Solution
There are 3 Steps involved in it

Get step-by-step solutions from verified subject matter experts