

Question: Answer these The efficiency ratio for a steel specimen immersed in a phosphating tank is the weight of the phosphate coating divided by the metal
Answer these
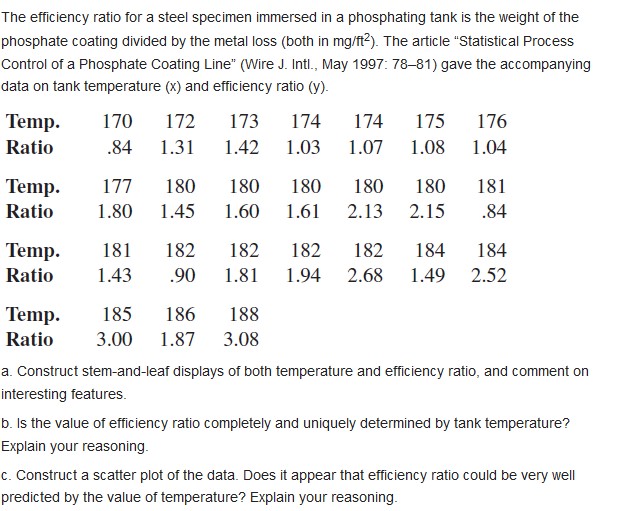
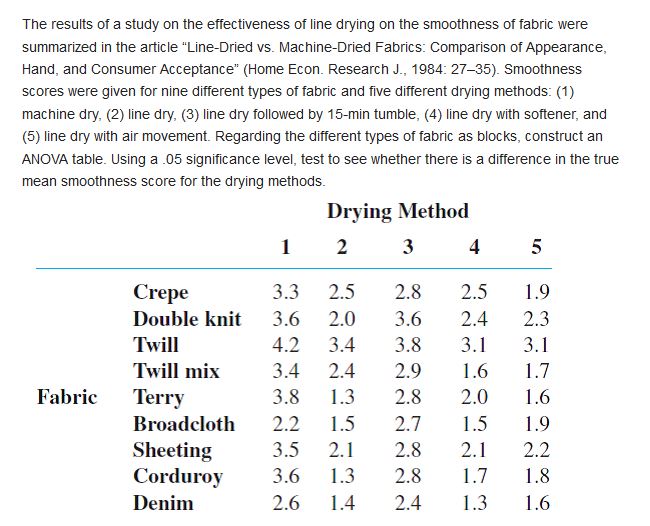
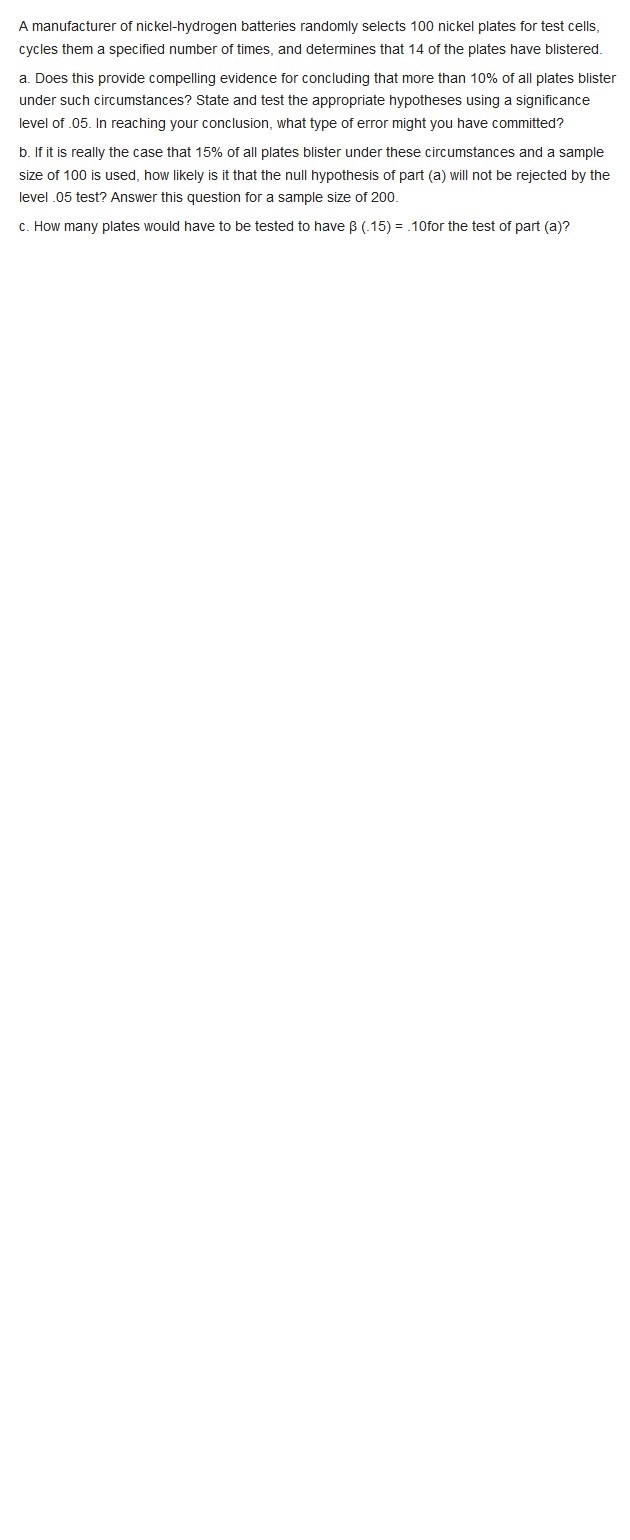
The efficiency ratio for a steel specimen immersed in a phosphating tank is the weight of the phosphate coating divided by the metal loss (both in mg/ft-). The article "Statistical Process Control of a Phosphate Coating Line" (Wire J. Intl., May 1997: 78-81) gave the accompanying data on tank temperature (x) and efficiency ratio (y). Temp. 170 172 173 174 174 175 176 Ratio .84 1.31 1.42 1.03 1.07 1.08 1.04 Temp. 177 180 180 180 180 180 181 Ratio 1.80 1.45 1.60 1.61 2.13 2.15 .84 Temp. 181 182 182 182 182 184 184 Ratio 1.43 90 1.81 1.94 2.68 1.49 2.52 Temp. 185 186 188 Ratio 3.00 1.87 3.08 a. Construct stem-and-leaf displays of both temperature and efficiency ratio, and comment on interesting features. b. Is the value of efficiency ratio completely and uniquely determined by tank temperature? Explain your reasoning. c. Construct a scatter plot of the data. Does it appear that efficiency ratio could be very well predicted by the value of temperature? Explain your reasoninga. Consider the data in Exercise 20. Suppose that instead of the least squares line passing through the points (X1, ),), . . .. (x, , y,), we wish the least squares line pass- ing through (x, - x, y,), . . . . (X, - X, y,,). Construct a scatter plot of the (x;, y,) points and then of the (x; - x, y.) points. Use the plots to explain intuitively how the two least squares lines are related to one another. b. Suppose that instead of the model Y, = Bo + Bix; + . we wish the E, (i = 1, . . ., n), we wish to fit a model of the form Y = Bo + Bj (x; - x) + e; (i = 1,..., n). What are the least squares estimators of B; and B;, and how do they relate to Bo and B,? least squares line passing through (x, - X, y,). .... (x,, - X, y,).. Construct a scatter plot of the points and then of the (x; - X, y.) points. Use the plots to explain intuitively how the two least squares lines are related to one another. b. Suppose that instead of the model Y, = Bo + Bix; + e; (i = 1, . ... n), , we wish to fit a model of the form Y = B; + Bj(x, - D) + e; (i = 1, .... "). and , and how do they relate to and Bo and B,?\fA manufacturer of nickelhydrogen batteries randomly selects 100 nickel plates for test cells, cycles them a specied number of times, and determines that 14 of the plates have blistered. a. Does this provide compelling evidence for concluding that more than 10% of all plates blister under such circumstances? State and test the appropriate hypotheses using a signicance level of .05. In reaching your conclusion, what type of error might you have committed? b. If it is really the case that 15% of all plates blister under these circumstances and a sample size of 100 is used, how likely is it that the null hypothesis of part (a) will not be rejected by the level .05 test? Answer this question for a sample size of 200. c. How many plates would have to be tested to have is (.15) = .10for the test or part (a)? In Exercise 55, suppose the experimenter had believed before collecting the data that the value of or was approximately .30. If the experimenter wished the probability of a type II error to be .05 when p = 3.00, was a sample size 50 unnecessarily large? Reference Exercise 65, A sample of50 lenses used in eyeglasses yields a sample mean thickness of3.05 mm and a sample standard deviation of .34 mm. The desired true average thickness of such lenses is 3.20 mm. Does the data strongly suggest that the true average thickness of such lenses is something other than what is desired? Test using (I = .05
Step by Step Solution
There are 3 Steps involved in it

Get step-by-step solutions from verified subject matter experts