

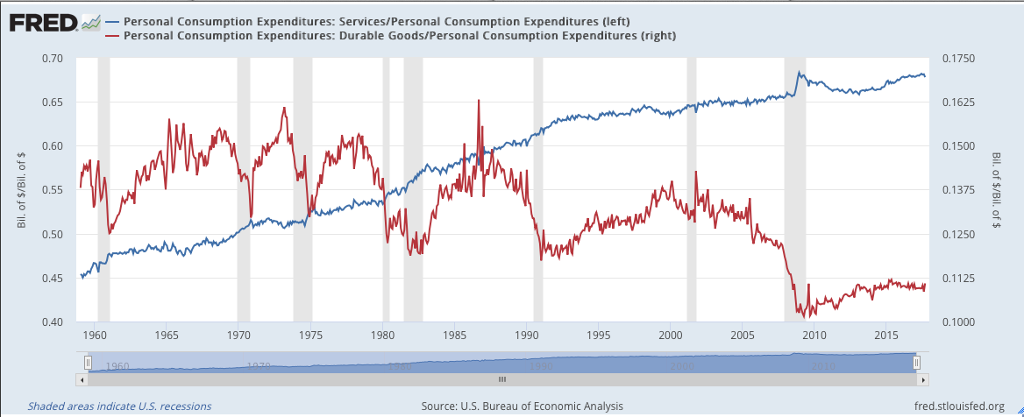
Question: Answer these questions using the graph provided above: -Describe what we are measuring here. What does this graph show us -Describe the relative importance and
Answer these questions using the graph provided above:
-Describe what we are measuring here. What does this graph show us
-Describe the relative importance and behavior of durables and services over the entire series.
-Contrast the behavior of these series during the past two recessions. What does this tell us?
-Offer some intuition as two why the behavior of the two series would differ so dramatically from each otherduring the past recession.
FREDPersonal Consumption Expenditures: Services/Personal Consumption Expenditures (left) Personal Consumption Expenditures: Durable Goods/Personal Consumption Expenditures (right) 0.70 0.1750 0.65 0.1625 0.60 0.1500 0.55 0.1375 0.50 0.1250 0.45 0.1125 0.40 0.1000 1960 1965 1970 1975 1980 1985 1990 1995 2000 2005 2010 2015 Shaded areas indicate U.S. recessions Source: U.S. Bureau of Economic Analysis fred.stlouisfed.org
Step by Step Solution
There are 3 Steps involved in it

Get step-by-step solutions from verified subject matter experts