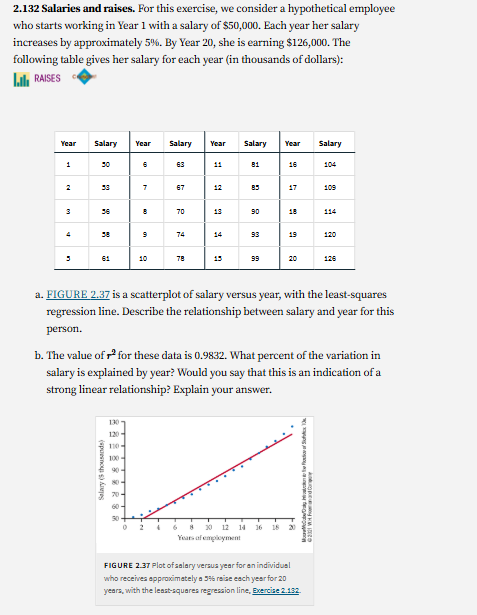
Question: answer this 2.132 Salaries and raises. For this exercise, we consider a hypothetical employee who starts working in Year 1 with a salary of $50,000.

answer this

answer this 2.132 Salaries and raises. For this
2.132 Salaries and raises. For this exercise, we consider a hypothetical employee who starts working in Year 1 with a salary of $50,000. Each year her salary increases by approximately 5%%. By Year 20, she is earning $126,000. The following table gives her salary for each year (in thousands of dollars): . RAISES Year salary Year Salary Year Salary Salary 1 91 17 108 114 14 120 78 99 a. FIGURE 2.37 is a scatterplot of salary versus year, with the least-squares regression line. Describe the relationship between salary and year for this person. b. The value of ' for these data is 0.9832. What percent of the variation in salary is explained by year? Would you say that this is an indication of a strong linear relationship? Explain your answer. 130 120- 110- 100 - 40 Salary ( it 70 60- 12 14 16 Yours of employment FIGURE 2 37 Plot of salary versus year for an individual who receives approximately a 936 reise each year for 20 years, with the least-squares regression line, Exercise 2.132

Step by Step Solution

There are 3 Steps involved in it

1 Expert Approved Answer
Step: 1 Unlock blur-text-image
Question Has Been Solved by an Expert!

Get step-by-step solutions from verified subject matter experts

Step: 2 Unlock
Step: 3 Unlock

Students Have Also Explored These Related Accounting Questions!