

Question: Salaries and raises. For this exercise we consider a hypothetical employee who starts working in Year 1 at a salary of $50,000. Each year her
Salaries and raises. For this exercise we consider a hypothetical employee who starts working in Year 1 at a salary of $50,000. Each year her salary increases by approximately 5%. By Year 20, she is earning $126,000. The table below gives her salary for each year (in thousands of dollars):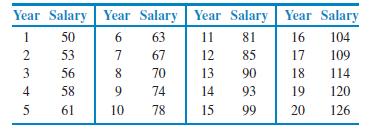
(a) Figure 2.29 is a scatterplot of salary versus year with the least-squares regression line. Describe the relationship between salary and year for this person.
(b) The value of r 2 for these data is 0.9832. What percent of the variation in salary is explained by year? Would you say that this is an indication of a strong linear relationship? Explain your answer.
Year Salary Year Salary Year Salary Year Salary 50 53 56 58 61 68119 63 11 81 16 104 7 67 12 85 17 109 70 13 90 18 114 74 14 93 19 120 10 78 15 99 20 126 12345
Step by Step Solution
There are 3 Steps involved in it

Get step-by-step solutions from verified subject matter experts