

Question: Answer this Target Segments Recreation 1st Priority Mountain 2nd Priority Speed 3rd Priority Answer this. Is this correct Use the information below to answer these.
Answer this
Target Segments
Recreation
1st Priority
Mountain
2nd Priority
Speed
3rd Priority
Answer this.
Is this correct

Use the information below to answer these. And Explain why.
Market Potential
Your market research firm has tried to derive an estimate of the potential demand by segment and geographic market. The researchers asked each customer:
How likely they would be to purchase a bicycle in the next 12 months.
How many products each customer would be likely to purchase if the customer decided to buy.
To complete the data collection, the researchers then counted the number of potential customers in each geographic market by segment.
It might seem strange to ask how many bicycles a potential customer might buy since most would only purchase one for themselves. However, there are occasions when a person would purchase more than one for him or herself (a mountain and a speed bike) or purchase a bike for a spouse or child. As a result, the average number of units purchased is actually more than 1.0. In a city like Amsterdam, everyone in the family might have a bike and it would not be unusual for a family to purchase more than one bike in a given year.
Taking all of these factors into consideration, the researchers applied the following equation to estimate market potential in each geographic location:
FORMULA
Market potential = probability of purchase number of units number of potential customers.
YOUR TASK
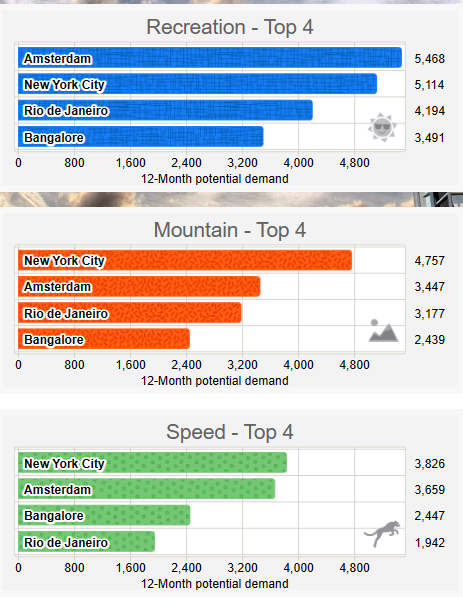
Review the potential market size of each segment and geographic market. The data indicates how many units could be purchased over the next 12 months. There is a separate estimate for market potential for each segment in each city.
DECISION TIP
Note that the data indicates the potential demand for the next 12 months. You might assume that 25% of the market potential would be realized in any quarter (as there are four quarters in a year). But this is not likely to happen.
First, the quality of your firm's decisions and those of your competitors will affect demand. In the early stages of market development, everyones marketing efforts and products are likely to be weak simply due to a lack of experience.
Second, it will take a few quarters for customers to learn about your new brands and their benefits. They might even be skeptical in the beginning.
For these reasons, actual demand is likely to be much less than potential demand in the early quarters. The opposite could be true a year from now.
Finally, be cautious in using this market information. At best, these estimates are very rough projections. Buying intentions are notorious for being wrong about actual purchases. The actual purchase rate will ultimately depend upon how well the product is designed, priced, advertised, and distributed, as well as how well you and your competition serve the market.
| Recreation
| Mountain
| Speed
| |
|---|---|---|---|
| New York City | 5,114 | 4,757 | 3,826 |
| Rio de Janeiro | 4,194 | 3,177 | 1,942 |
| Amsterdam | 5,468 | 3,447 | 3,659 |
| Bangalore | 3,491 | 2,439 | 2,447 |
Having reviewed the market research data, it is time to decide on your initial business strategy.
YOUR TASK
Develop an overall strategy before you start to make tactical decisions:
Formulate a mission statement for the firm. How do you want to be perceived by your customers and competition?
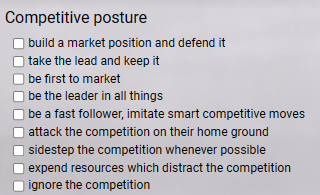
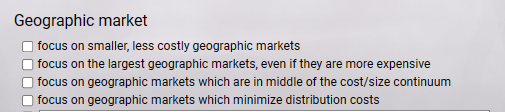
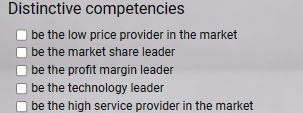
Decide on your strategic direction. What will be your target markets, market position, competitive posture, and distinctive competencies?
DECISION TIP
Each company is required to designate its primary and secondary target segments. As your firm gains experience and resources, you may want to target more than two segments. Sales to all segments will increase your revenues and help improve your performance. However, keep in mind that even if you target more than two segments, it is still critical for you to carefully select your primary and secondary segments. This is because the Balanced Scorecard uses only those two specified segments (primary and secondary) in the marketing calculations. As a result, the Market Performance and Marketing Effectiveness indicators will solely be based on your primary and secondary target segment selections even if you are targeting more than two segments.
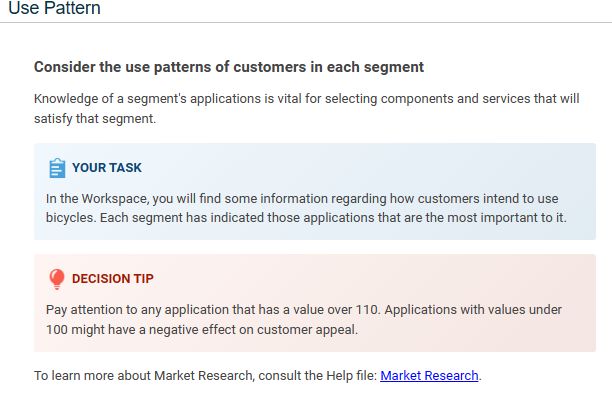
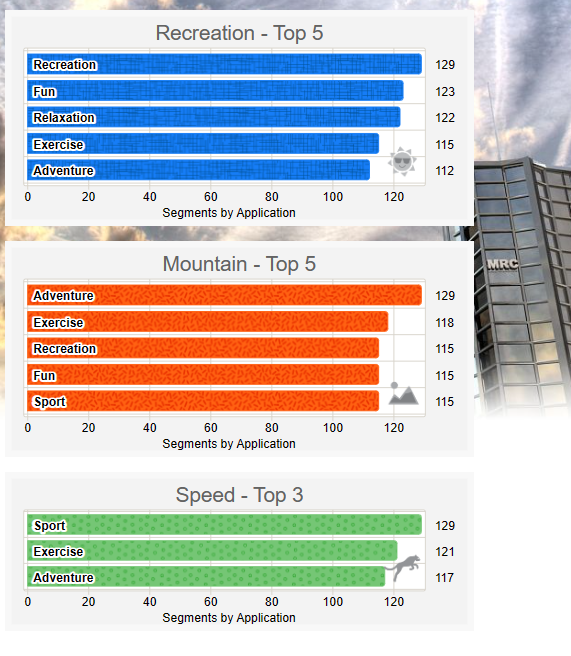
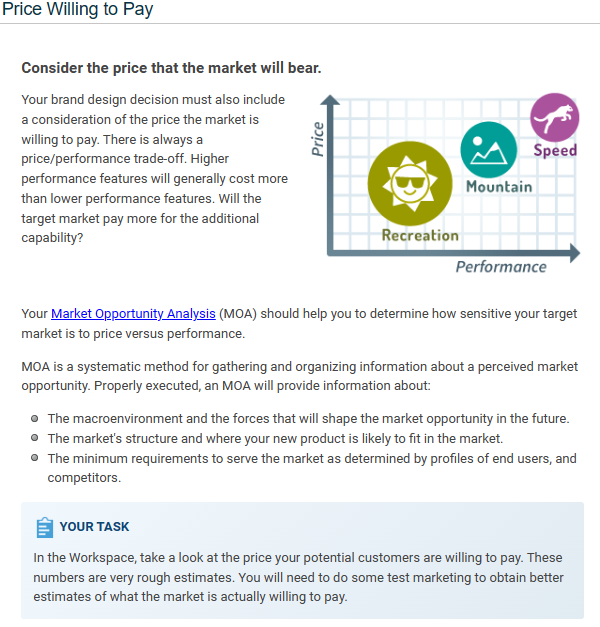
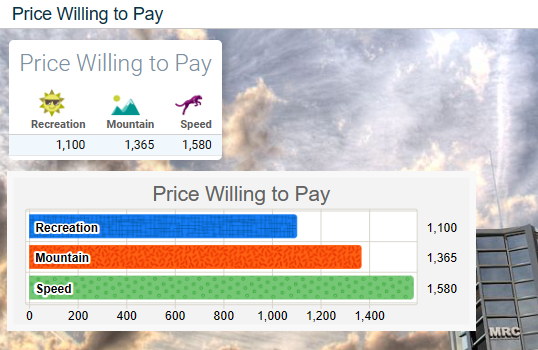
Market size focus on smaller, high margin segments focus on large, highly competitive segments focus on fringe segments that are out of the mainstream Competitive posture build a market position and defend it take the lead and keep it be first to market be the leader in all things be a fast follower, imitate smart competitive moves attack the competition on their home ground sidestep the competition whenever possible expend resources which distract the competition ignore the competition Geographic market focus on smaller, less costly geographic markets focus on the largest geographic markets, even if they are more expensive focus on geographic markets which are in middle of the cost/size continuum focus on geographic markets which minimize distribution costs Distinctive competencies be the low price provider in the market be the market share leader be the profit margin leader be the technology leader be the high service provider in the market Consider the use patterns of customers in each segment Knowledge of a segment's applications is vital for selecting components and services that will satisfy that segment. YOUR TASK In the Workspace, you will find some information regarding how customers intend to use bicycles. Each segment has indicated those applications that are the most important to it. DECISION TIP Pay attention to any application that has a value over 110. Applications with values under 100 might have a negative effect on customer appeal. To learn more about Market Research, consult the Help file: Market Research. Recreation - Top 5 Speed - Top 3 Consider the price that the market will bear. Your brand design decision must also include a consideration of the price the market is willing to pay. There is always a price/performance trade-off. Higher performance features will generally cost more than lower performance features. Will the target market pay more for the additional capability? Your Market Opportunity Analysis (MOA) should help you to determine how sensitive your target market is to price versus performance. MOA is a systematic method for gathering and organizing information about a perceived market opportunity. Properly executed, an MOA will provide information about: The macroenvironment and the forces that will shape the market opportunity in the future. The market's structure and where your new product is likely to fit in the market. The minimum requirements to serve the market as determined by profiles of end users, and competitors. YOUR TASK In the Workspace, take a look at the price your potential customers are willing to pay. These numbers are very rough estimates. You will need to do some test marketing to obtain better estimates of what the market is actually willing to pay. Price Willing to Pay Price Willing to Pay Price Willing to Pay Recreation - Top 4 \begin{tabular}{|l|l|} \hline Amsterdam & 5,468 \\ \hline New YorkCity & 5,114 \\ \hline RiodeJanefro & 4,194 \\ \hline Bangalore & 3,491 \\ \hline \end{tabular} 0 8001,6002,4003,2004,0004,800 12-Month potential demand Mountain - Top 4 Speed - Top 4 \begin{tabular}{|l|l|l|} \hline New York City & 3,826 \\ \hline Amsterdam & 3,659 \\ \hline Bangalore & 2,447 \\ \hline Rio de Janeiro & 1,942 \\ \hline \end{tabular}
Step by Step Solution
There are 3 Steps involved in it

Get step-by-step solutions from verified subject matter experts