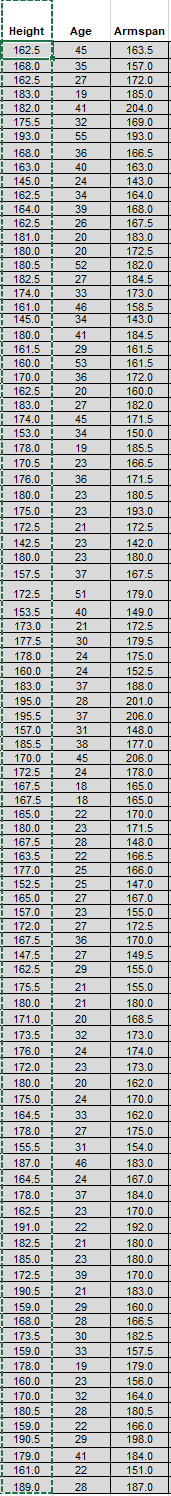
Question: Answer using excel format! 2. Complete the following in regard to the Armspan and Height factors in the data set: a. In the region to

Answer using excel format!

Answer using excel format! 2. Complete the

Answer using excel format! 2. Complete the

2. Complete the following in regard to the Armspan and Height factors in the data set: a. In the region to the right, produce a scatterplot of the Armspan versus Height data (remember this means Height runs along the horizontal axis as the independent variable and Armspan along the vertical axis as the dependent variable.) Adjust your horizontal and vertical scaling to keep the primary focus of the graph to the region in which the points lie. Label the axes and make a descriptive title to the display. For help, see Unit 3 Excel Guide (Part 2). Based upon your scatterplot, briefly discuss below your thoughts on whether the visual" trend between the indissiduals' armsnan and height annears linear cursilinear or has no general trend at all b. Complete the following: i. Include the trend line's graph and equation (least squares line) on the scatterplot created in part a. Give the line's equation below and explain within this context what the "x" and "y" variables represent in the equation. ii. Below, explicitly state the slope of your trend line and discuss what the value of the slope signifies in terms of this context c. Determine the value of the correlation coefficient (r) for this paired data. Explain what this value tells you regarding these two variables. Next, determine the value of the coefficient of determination (r^2) for this paired data. Explain what this value tells you regarding these two variables. d. Using the least squares linear prediction equation from part bi. above, predict the armspan of an individual whose height is 200 cm. Show work to the right. e. Finally, critique the statement since the correlation coefficient is strong positive correlation" then this means that "being taller causes one to have a longer armspan. Specifically address the issue of "causation" in relation to statistical correlation 1 Height 162.5 ! 168.0 ! 162.5 ! 183.0 ! 182.0 175.5 193.0 1 168.0 ! 163.0 1 1145.0 ! 162.5 ! ! 164.0 ! 162.5 i 181.0 i 180.0 | 180.5 i i 182.5 i i 174.0 i 161.0 1 145.0 i 180.0 161.5 160.0 170.0 162.5 183.0 174.0 ! 153.0! I 178.0 Age 45 35 27 19 41 32 55 36 40 24 34 39 26 20 20 52 27 33 46 34 41 29 53 36 20 27 45 34 19 23 36 23 23 21 23 23 37 Armspan 163.5 157.0 172.0 185.0 204.0 169.0 193.0 166.5 163.0 143.0 164.0 168.0 167.5 183.0 172.5 182.0 184.5 173.0 158.5 143.0 184.5 161.5 161.5 172.0 160.0 182.0 171.5 150.0 185.5 166.5 171.5 non 180.5 200 193.0 172.5 142.0 180.0 167.5 170.5 i 176.0 i 180.0 ! 175.0 ! 172.5 ! 142.5 180.0 i 157.5 i 51 167.5 40 21 30 24 24 37 28 37 31 38 45 24 18 18 22 23 28 22 25 25 27 23 27 36 27 29 172.5 ! 153.5 1 173.0 ! 177.5 ! 178.0 1 160.0! I 183.0! 195.0! 195.5 157.0 185.5 1 170.0 ! 172.5 1 ! 167.5 ! 1 165.0 | 180.0! 167.5 163.5 ! 177.0 152.5 1 165.0 i i 157.0 i 172.0 167.5 i 147.5 i 162.5 ! 175.5! 2000 180.0 i 171.0 i 173.5 2200 ! 176.0! 2200 172.0 2000 180.0 i 175.0 e i 164.5 2200 ! 178.0 1 ACES 155.5 2020 i 187.0 end i 164.5 2200 ! 2 162.5 2010 191.0 20 i 182.5 i 185.0 172.5 190.5 i 159.0 168.0 i 173.5 i 159.0 i 178.0 1 i 160.0i 170.0 1 ! 180.5 ! 159.0 ! 190.5 1 179.0 149.0 172.5 179.5 175.0 152.5 188 0 201.0 206.0 148.0 177.0 206. 178.0 165,0 165.0 170.0 171.5 148.0 166.5 166.0 147.0 167.0 155.0 172.5 170.0 149.5 155.0 155.0 200 180.0 200 168.5 173.0 174.0 173.0 162.0 2 170.0 162.0 22 175.0 154.0 400 183.0 402 167.0 184.0 170.0 192.0 180.0 200 180.0 170.0 183.0 160.0 166.5 182.5 157.5 179.0 156.0 164.0 180.5 166.0 198.0 184.0 151.0 i 178.0 21 21 20 32 24 23 20 24 33 27 31 46 24 37 23 22 21 23 39 21 29 28 30 33 19 23 32 28 22 29 41 22 28 1 ! 179.0 ! 161.0 1_189.0 / 187.0 2. Complete the following in regard to the Armspan and Height factors in the data set: a. In the region to the right, produce a scatterplot of the Armspan versus Height data (remember this means Height runs along the horizontal axis as the independent variable and Armspan along the vertical axis as the dependent variable.) Adjust your horizontal and vertical scaling to keep the primary focus of the graph to the region in which the points lie. Label the axes and make a descriptive title to the display. For help, see Unit 3 Excel Guide (Part 2). Based upon your scatterplot, briefly discuss below your thoughts on whether the visual" trend between the indissiduals' armsnan and height annears linear cursilinear or has no general trend at all b. Complete the following: i. Include the trend line's graph and equation (least squares line) on the scatterplot created in part a. Give the line's equation below and explain within this context what the "x" and "y" variables represent in the equation. ii. Below, explicitly state the slope of your trend line and discuss what the value of the slope signifies in terms of this context c. Determine the value of the correlation coefficient (r) for this paired data. Explain what this value tells you regarding these two variables. Next, determine the value of the coefficient of determination (r^2) for this paired data. Explain what this value tells you regarding these two variables. d. Using the least squares linear prediction equation from part bi. above, predict the armspan of an individual whose height is 200 cm. Show work to the right. e. Finally, critique the statement since the correlation coefficient is strong positive correlation" then this means that "being taller causes one to have a longer armspan. Specifically address the issue of "causation" in relation to statistical correlation 1 Height 162.5 ! 168.0 ! 162.5 ! 183.0 ! 182.0 175.5 193.0 1 168.0 ! 163.0 1 1145.0 ! 162.5 ! ! 164.0 ! 162.5 i 181.0 i 180.0 | 180.5 i i 182.5 i i 174.0 i 161.0 1 145.0 i 180.0 161.5 160.0 170.0 162.5 183.0 174.0 ! 153.0! I 178.0 Age 45 35 27 19 41 32 55 36 40 24 34 39 26 20 20 52 27 33 46 34 41 29 53 36 20 27 45 34 19 23 36 23 23 21 23 23 37 Armspan 163.5 157.0 172.0 185.0 204.0 169.0 193.0 166.5 163.0 143.0 164.0 168.0 167.5 183.0 172.5 182.0 184.5 173.0 158.5 143.0 184.5 161.5 161.5 172.0 160.0 182.0 171.5 150.0 185.5 166.5 171.5 non 180.5 200 193.0 172.5 142.0 180.0 167.5 170.5 i 176.0 i 180.0 ! 175.0 ! 172.5 ! 142.5 180.0 i 157.5 i 51 167.5 40 21 30 24 24 37 28 37 31 38 45 24 18 18 22 23 28 22 25 25 27 23 27 36 27 29 172.5 ! 153.5 1 173.0 ! 177.5 ! 178.0 1 160.0! I 183.0! 195.0! 195.5 157.0 185.5 1 170.0 ! 172.5 1 ! 167.5 ! 1 165.0 | 180.0! 167.5 163.5 ! 177.0 152.5 1 165.0 i i 157.0 i 172.0 167.5 i 147.5 i 162.5 ! 175.5! 2000 180.0 i 171.0 i 173.5 2200 ! 176.0! 2200 172.0 2000 180.0 i 175.0 e i 164.5 2200 ! 178.0 1 ACES 155.5 2020 i 187.0 end i 164.5 2200 ! 2 162.5 2010 191.0 20 i 182.5 i 185.0 172.5 190.5 i 159.0 168.0 i 173.5 i 159.0 i 178.0 1 i 160.0i 170.0 1 ! 180.5 ! 159.0 ! 190.5 1 179.0 149.0 172.5 179.5 175.0 152.5 188 0 201.0 206.0 148.0 177.0 206. 178.0 165,0 165.0 170.0 171.5 148.0 166.5 166.0 147.0 167.0 155.0 172.5 170.0 149.5 155.0 155.0 200 180.0 200 168.5 173.0 174.0 173.0 162.0 2 170.0 162.0 22 175.0 154.0 400 183.0 402 167.0 184.0 170.0 192.0 180.0 200 180.0 170.0 183.0 160.0 166.5 182.5 157.5 179.0 156.0 164.0 180.5 166.0 198.0 184.0 151.0 i 178.0 21 21 20 32 24 23 20 24 33 27 31 46 24 37 23 22 21 23 39 21 29 28 30 33 19 23 32 28 22 29 41 22 28 1 ! 179.0 ! 161.0 1_189.0 / 187.0

Step by Step Solution

There are 3 Steps involved in it

1 Expert Approved Answer
Step: 1 Unlock blur-text-image
Question Has Been Solved by an Expert!

Get step-by-step solutions from verified subject matter experts

Step: 2 Unlock
Step: 3 Unlock

Students Have Also Explored These Related General Management Questions!