

Question: Answer using Excel. Show all steps and formulas on Excel please! Question 5 Problem: As mentioned on question 5: Reconsider the data from Problem 4.
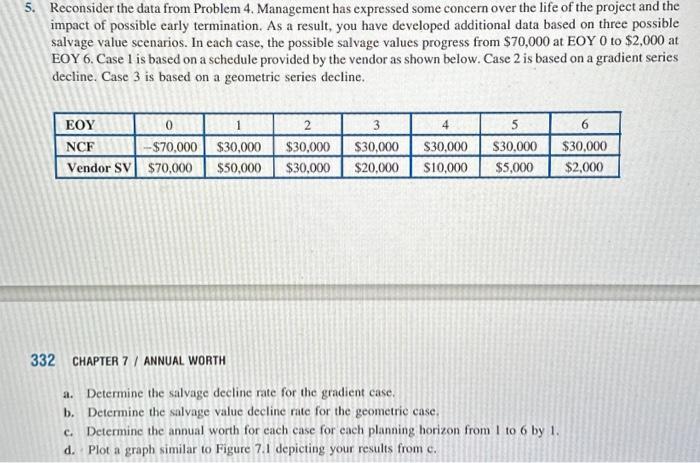
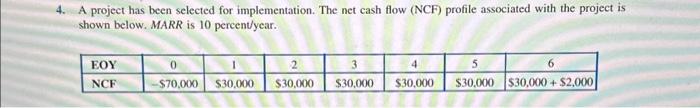
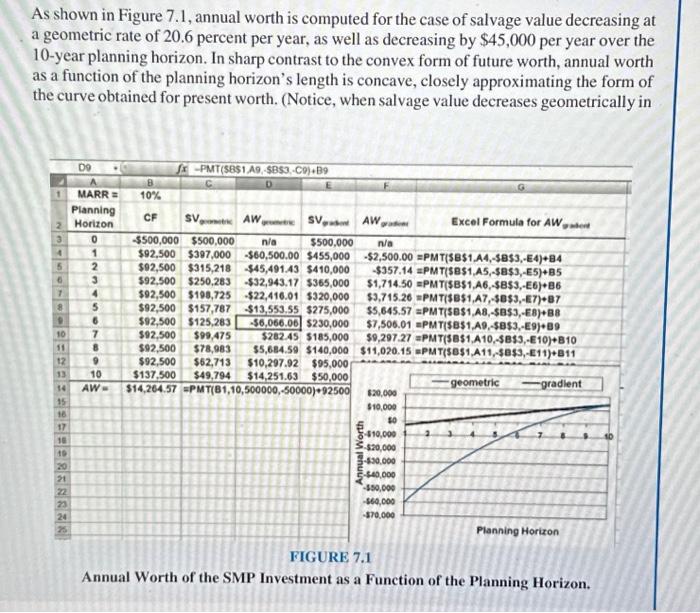
5. Reconsider the data from Problem 4. Management has expressed some concern over the life of the project and the impact of possible carly termination. As a result, you have developed additional data based on three possible salvage value scenarios. In each case, the possible salvage values progress from $70,000 at EOY 0 to $2,000 at EOY 6. Case 1 is based on a schedule provided by the vendor as shown below. Case 2 is based on a gradient series decline. Case 3 is based on a geometric series decline. 332 CHAPTER 7 / ANNUAL WORTH a. Determine the salvage decline rate for the gradient case. b. Determine the salvage value decline rate for the geometric case. c. Determine the annual worth for each case for each planning horizon from 1 to 6 by 1 . d. Plot a graph similar to Figure 7.1 depicting your results from c. As shown in Figure 7.1, annual worth is computed for the case of salvage value decreasing at a geometric rate of 20.6 percent per year, as well as decreasing by $45,000 per year over the 10 -year planning horizon. In sharp contrast to the convex form of future worth, annual worth as a function of the planning horizon's length is concave, closely approximating the form of the curve obtained for present worth. (Notice, when salvage value decreases geometrically in Annual worth of the SMP Investment as a Function of the Planning Horizon. 4. A project has been selected for implementation. The net cash flow (NCF) profile associated with the project i shown below. MARR is 10 percent/year
Step by Step Solution
There are 3 Steps involved in it

Get step-by-step solutions from verified subject matter experts