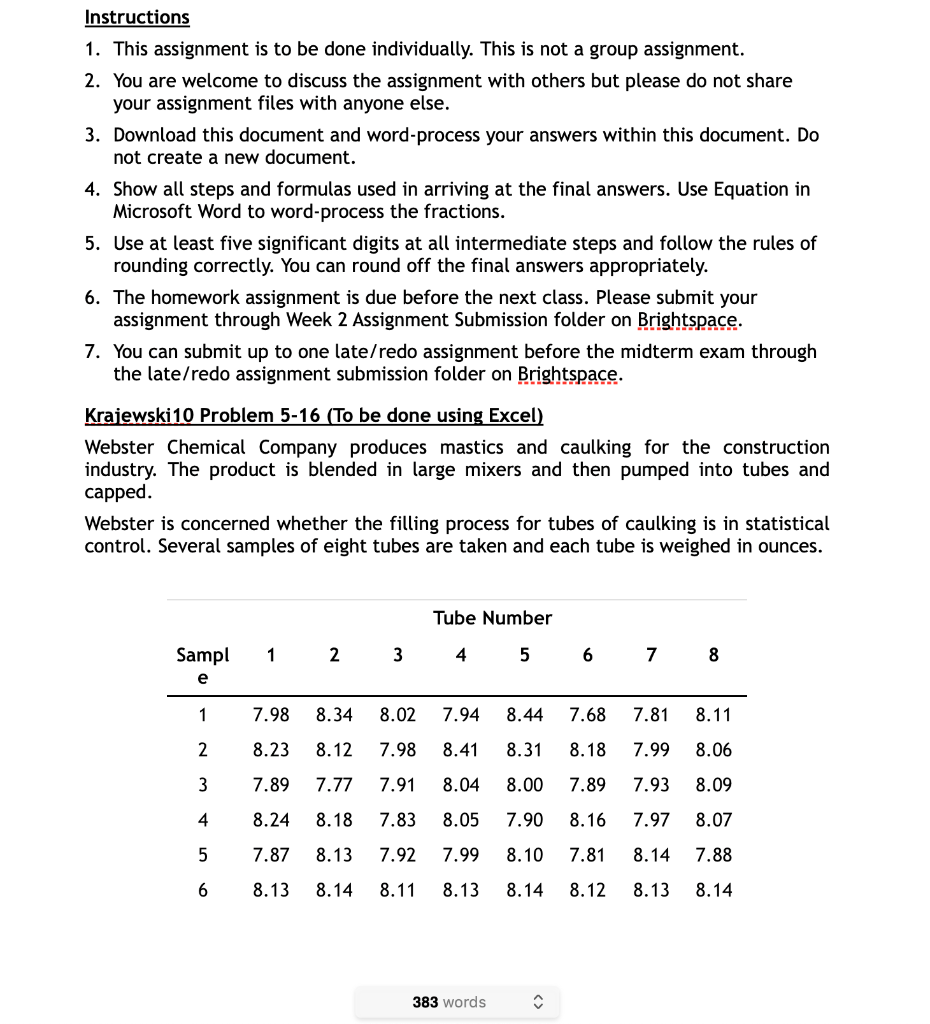
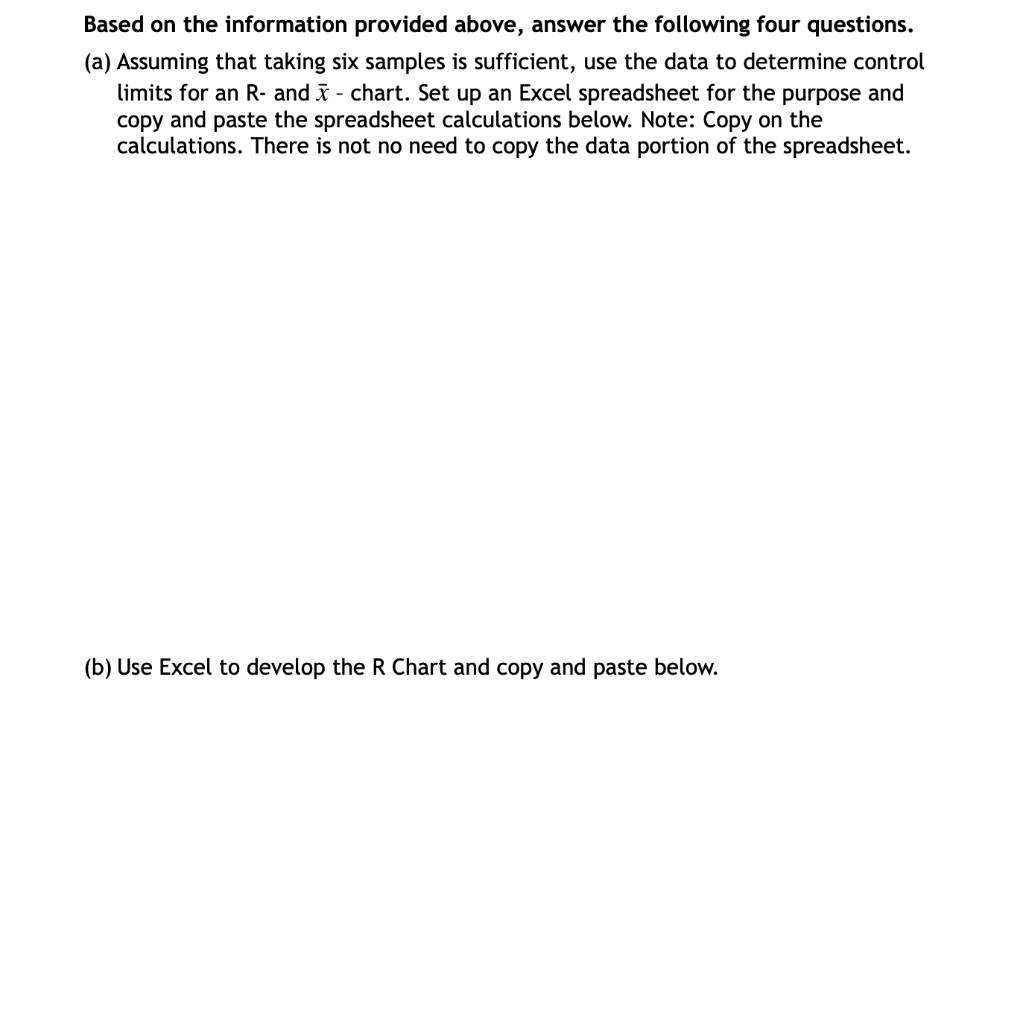
Question: Instructions 1. This assignment is to be done individually. This is not a group assignment. 2. You are welcome to discuss the assignment with others

Instructions 1. This assignment is to be doneInstructions 1. This assignment is to be done

Instructions 1. This assignment is to be done individually. This is not a group assignment. 2. You are welcome to discuss the assignment with others but please do not share your assignment files with anyone else. 3. Download this document and word-process your answers within this document. Do not create a new document. 4. Show all steps and formulas used in arriving at the final answers. Use Equation in Microsoft Word to word-process the fractions. 5. Use at least five significant digits at all intermediate steps and follow the rules of rounding correctly. You can round off the final answers appropriately. 6. The homework assignment is due before the next class. Please submit your assignment through Week 2 Assignment Submission folder on Brightspace. 7. You can submit up to one late/redo assignment before the midterm exam through the late/redo assignment submission folder on Brightspace. Krajewski 10 Problem 5-16 (To be done using Excel) Webster Chemical Company produces mastics and caulking for the construction industry. The product is blended in large mixers and then pumped into tubes and capped. Webster is concerned whether the filling process for tubes of caulking is in statistical control. Several samples of eight tubes are taken and each tube is weighed in ounces. Tube Number Sampl 1 2 3 4 5 6 7 8 e 1 7.98 8.34 8.02 7.94 8.44 7.68 7.81 8.11 2 8.23 8.12 7.98 8.41 8.31 8.18 7.99 8.06 3 7.89 7.77 7.91 8.04 8.00 7.89 7.93 8.09 4 8.24 8.18 7.83 8.05 7.90 8.16 7.97 8.07 5 7.87 8.13 7.92 7.99 8.10 7.81 8.14 7.88 6 8.13 8.14 8.11 8.13 8.14 8.12 8.13 8.14 383 words Based on the information provided above, answer the following four questions. (a) Assuming that taking six samples is sufficient, use the data to determine control limits for an R- and - chart. Set up an Excel spreadsheet for the purpose and copy and paste the spreadsheet calculations below. Note: Copy on the calculations. There is not no need to copy the data portion of the spreadsheet. (b) Use Excel to develop the R Chart and copy and paste below. Instructions 1. This assignment is to be done individually. This is not a group assignment. 2. You are welcome to discuss the assignment with others but please do not share your assignment files with anyone else. 3. Download this document and word-process your answers within this document. Do not create a new document. 4. Show all steps and formulas used in arriving at the final answers. Use Equation in Microsoft Word to word-process the fractions. 5. Use at least five significant digits at all intermediate steps and follow the rules of rounding correctly. You can round off the final answers appropriately. 6. The homework assignment is due before the next class. Please submit your assignment through Week 2 Assignment Submission folder on Brightspace. 7. You can submit up to one late/redo assignment before the midterm exam through the late/redo assignment submission folder on Brightspace. Krajewski 10 Problem 5-16 (To be done using Excel) Webster Chemical Company produces mastics and caulking for the construction industry. The product is blended in large mixers and then pumped into tubes and capped. Webster is concerned whether the filling process for tubes of caulking is in statistical control. Several samples of eight tubes are taken and each tube is weighed in ounces. Tube Number Sampl 1 2 3 4 5 6 7 8 e 1 7.98 8.34 8.02 7.94 8.44 7.68 7.81 8.11 2 8.23 8.12 7.98 8.41 8.31 8.18 7.99 8.06 3 7.89 7.77 7.91 8.04 8.00 7.89 7.93 8.09 4 8.24 8.18 7.83 8.05 7.90 8.16 7.97 8.07 5 7.87 8.13 7.92 7.99 8.10 7.81 8.14 7.88 6 8.13 8.14 8.11 8.13 8.14 8.12 8.13 8.14 383 words Based on the information provided above, answer the following four questions. (a) Assuming that taking six samples is sufficient, use the data to determine control limits for an R- and - chart. Set up an Excel spreadsheet for the purpose and copy and paste the spreadsheet calculations below. Note: Copy on the calculations. There is not no need to copy the data portion of the spreadsheet. (b) Use Excel to develop the R Chart and copy and paste below

Step by Step Solution

There are 3 Steps involved in it

1 Expert Approved Answer
Step: 1 Unlock blur-text-image
Question Has Been Solved by an Expert!

Get step-by-step solutions from verified subject matter experts

Step: 2 Unlock
Step: 3 Unlock

Students Have Also Explored These Related General Management Questions!