

Question: Answer using matlab Question 3 ( 8 points ) You are tasked with analyzing data collected from a fitness tracker worn by a person during
Answer using matlab
Question points
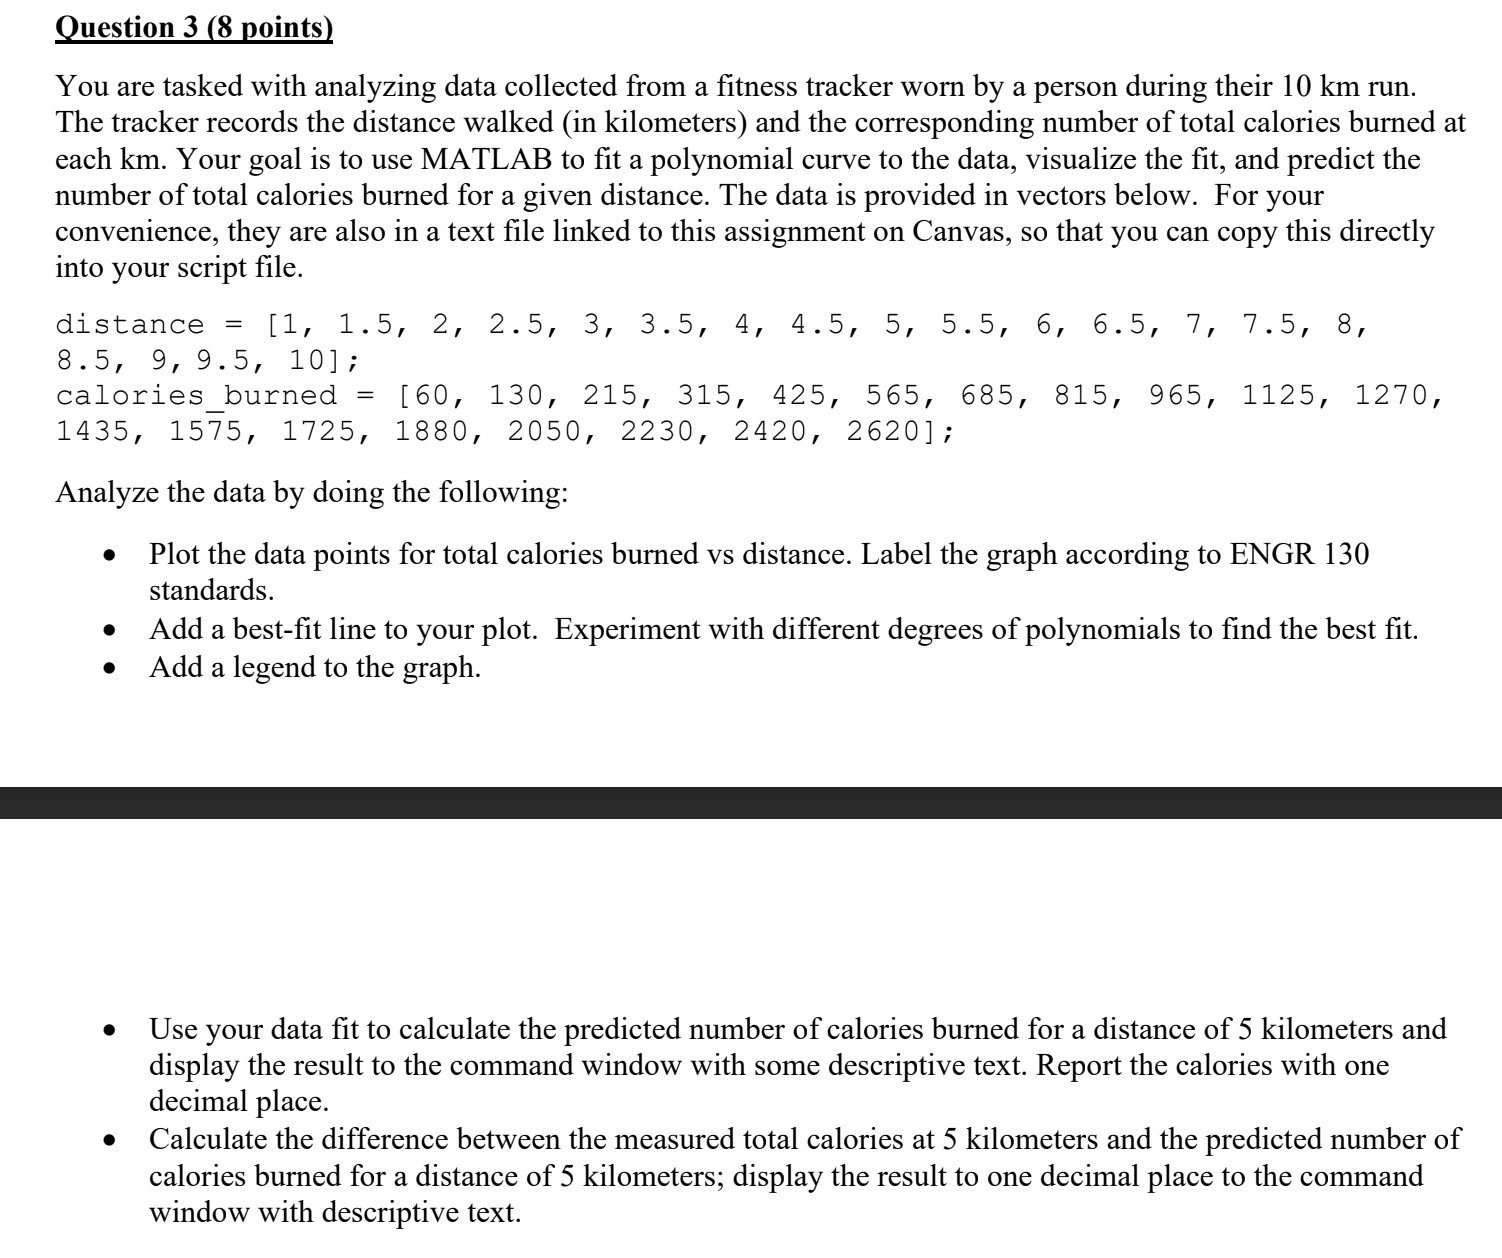
You are tasked with analyzing data collected from a fitness tracker worn by a person during their run.
The tracker records the distance walked in kilometers and the corresponding number of total calories burned at
each Your goal is to use MATLAB to fit a polynomial curve to the data, visualize the fit, and predict the
number of total calories burned for a given distance. The data is provided in vectors below. For your
convenience, they are also in a text file linked to this assignment on Canvas, so that you can copy this directly
into your script file.
distance
;
caloriesburned
;
Analyze the data by doing the following:
Plot the data points for total calories burned vs distance. Label the graph according to ENGR
standards.
Add a bestfit line to your plot. Experiment with different degrees of polynomials to find the best fit.
Add a legend to the graph.
Use your data fit to calculate the predicted number of calories burned for a distance of kilometers and
display the result to the command window with some descriptive text. Report the calories with one
decimal place.
Calculate the difference between the measured total calories at kilometers and the predicted number of
calories burned for a distance of kilometers; display the result to one decimal place to the command
window with descriptive text.
Step by Step Solution
There are 3 Steps involved in it
1 Expert Approved Answer
Step: 1 Unlock

Question Has Been Solved by an Expert!
Get step-by-step solutions from verified subject matter experts
Step: 2 Unlock
Step: 3 Unlock