

Question: answerr asapppp a. Use the data given to calculate annual returns for Bartman, Reynolds, and the Wiltor 5000 Index, and then calculate average returns over
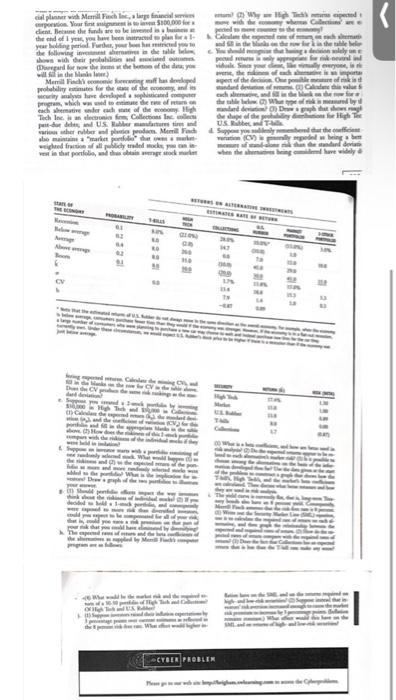
a. Use the data given to calculate annual returns for Bartman, Reynolds, and the Wiltor 5000 Index, and then calculate average returns over the 5-year period. (Hit Remember returns are calculated by subtracting the beginning price from the ending price to get the capital gain or loss, adding the dividend to the capital gain or lom, and dividing the resal by the beginning price. Assume that dividends are already included in the index. Also, you cannot calculate the rate of return for 1996 because you do not have 1995 data) b. Calculate the standard deviations of the returns for Bartman, Reynolds, and the Wilto 5000. (Hint: Use the sample standard deviation formula given in Footnote 5 so this chap ter, which corresponds to the STDEV function in Earl) c. Now calculate the coefficients of variation for Bartman, Reynolds, and the Wilon 5000 d. Construct a scatter diagram graph that shows Bartman's and Reynolds' returns on the ver tical axis and the market index's returns on the horizontal axis e. Estimate Bartman's and Reynolds' betas by running regressions of their returns against the Wilon 5000's returns. Are these betas consistent with your graph? The risk-free rate on long-term Treasury bonds is 6.04 percent. Assume that the aveng annual return on the Wilton 5000 is not a good estimate of the marker's required return- it is too high, so use 11 percent as the expected return on the market. Now use the SMI equation to calculate the two companies' required returns. g. If you formed a portfolio that consisted of 50 percent of Bartman stock and 50 percent o Reynolds stock, what would be the bets and the required return for the portfolio? h. Suppose an investor wants to include Bartman Industries' stock in his or her portfolio Stocks A, B, and C are currently in the portfolio, and their betas are 0769, 0.985 and 1.423, respectively. Calculate the new portfolios required return if it consists o 25 percent of Bartman, 15 percent of Stock A, 40 percent of Stock B, and 20 percent Stock C INTEGRATED CASE MERRILL FINCH INC. inge the ion described, never the follow Why is the The independent of the state the Thill proply High Toh m pected wher Why ped to move to the y of ser he table bel decision modely rik-end i simp 5-23 Rick and return Aue that you recently graduated with in finance, and you just landed job sea finan cial planner with Merrill Finch Inc, a large financial services corporation. Your first aignent is to invest $100,000 dent. Because the funds are to be invested in baie the end of 1 year, you have been instructed to plan for a 1-& Clem year holding period. Further, your bous has nericted you to add the following and heat is the table be.You should engine that being shows widh deir probabilions and acted to predis only appea Diarged for now the at the home of the desk Syd, the will fill in the Mask later) of a Merrill Finch's con foncting staff has developedpect of the decine, Our ple mure of ik probability estimates for the state of the acony, and indeed deviation of () Call security analysts have developed a sophisticaned computer in the Mek program, which was used to estimats de rate of each abne under each stane of the Tech Inc. is an dectesnio fon Collections Inc. collects pan-dor de and US Rabber manfaction various other ber and plastic prodams Merrill Finch aho maintains a "market por dat wameket weighted fraction of all publicly traded suck you vest in that portfolia, and the chain average stock marke this Whare ruf mik High each beating, and the the below standard deviation the shape of the prodig US. Read T 4. Suppone you bely end p and of ander when the sem being TRACTATIVE INVESTMENTS ESTIMATE TEF RETUR THE CO YMOUS V in Sw Avemp an A JA 199 Nags 84 M A.R A F ca MA Ha High The de muntand dev deed have widely d (2) Why High Texpected whes Collection the e of s - cial planner with Merrill Finch Inc, a large financial servi corporation. Your first assignent is to $100,000 client. Because the funds are to be invened in a busines the end of 1 year, you have been instructed to plan for a 1- year holding period. Furder, your bom has stricted you to expeed banks on the s the table belor decision solely on s pedres is only approprie for rik-nevral ind indoo the following investest shernatives in the table le. You should mengise that haing shown with their probabilities and Dogard for now the ins at the boon of the da; you will fill in the Man in your chevilly everyone, is n aver, the res of each a importa spect of the decision One pomible mature of k andand deviation of (1) Calendare this value each alem, and fill in the bank the table below Whar pe of risk is measured by and dev0) Des graph that shows g edhe shape of the piny d Merrill Finck's cooponie forecasting maff has developed probability estimates for the state of the economy and in security analyses have developed a sophisticated computer program, which was used to estimate the rease of on each shemative under each one of the economy. High Tech Inc. is an electronics fem Collections Inc. pat-dor deles, and US Rabber manufactures tires and various other rubber and plastic products. Merrill Fach sho maintains a "market port that we market weighted fraction of all publicly traded ocks vest in that portfolio, and thus obtain average stock US Rabber and T-k be & Suppo you suddenly membered that the coffin vation (CV) y repedel surf when the are being TURNS ON ALTERNATIVE WRESTMENTS ESTIMATES RATE OF RETURN sta o PROSABILITY Re BUITINNG 61 Below eng 3625 N Bon CV s Dhe de CV p deviation Cada d w b) How d mpart 42 M Should perde Cal ped to iden would y that could you your nk that you e The expected the M SPS 60 40 40 11 - On 110 19 CYBER PROBLEM + a z. , a n MN ME 30000 a. Use the data given to calculate annual returns for Bartman, Reynolds, and the Wiltor 5000 Index, and then calculate average returns over the 5-year period. (Hit Remember returns are calculated by subtracting the beginning price from the ending price to get the capital gain or loss, adding the dividend to the capital gain or lom, and dividing the resal by the beginning price. Assume that dividends are already included in the index. Also, you cannot calculate the rate of return for 1996 because you do not have 1995 data) b. Calculate the standard deviations of the returns for Bartman, Reynolds, and the Wilto 5000. (Hint: Use the sample standard deviation formula given in Footnote 5 so this chap ter, which corresponds to the STDEV function in Earl) c. Now calculate the coefficients of variation for Bartman, Reynolds, and the Wilon 5000 d. Construct a scatter diagram graph that shows Bartman's and Reynolds' returns on the ver tical axis and the market index's returns on the horizontal axis e. Estimate Bartman's and Reynolds' betas by running regressions of their returns against the Wilon 5000's returns. Are these betas consistent with your graph? The risk-free rate on long-term Treasury bonds is 6.04 percent. Assume that the aveng annual return on the Wilton 5000 is not a good estimate of the marker's required return- it is too high, so use 11 percent as the expected return on the market. Now use the SMI equation to calculate the two companies' required returns. g. If you formed a portfolio that consisted of 50 percent of Bartman stock and 50 percent o Reynolds stock, what would be the bets and the required return for the portfolio? h. Suppose an investor wants to include Bartman Industries' stock in his or her portfolio Stocks A, B, and C are currently in the portfolio, and their betas are 0769, 0.985 and 1.423, respectively. Calculate the new portfolios required return if it consists o 25 percent of Bartman, 15 percent of Stock A, 40 percent of Stock B, and 20 percent Stock C INTEGRATED CASE MERRILL FINCH INC. inge the ion described, never the follow Why is the The independent of the state the Thill proply High Toh m pected wher Why ped to move to the y of ser he table bel decision modely rik-end i simp 5-23 Rick and return Aue that you recently graduated with in finance, and you just landed job sea finan cial planner with Merrill Finch Inc, a large financial services corporation. Your first aignent is to invest $100,000 dent. Because the funds are to be invested in baie the end of 1 year, you have been instructed to plan for a 1-& Clem year holding period. Further, your bous has nericted you to add the following and heat is the table be.You should engine that being shows widh deir probabilions and acted to predis only appea Diarged for now the at the home of the desk Syd, the will fill in the Mask later) of a Merrill Finch's con foncting staff has developedpect of the decine, Our ple mure of ik probability estimates for the state of the acony, and indeed deviation of () Call security analysts have developed a sophisticaned computer in the Mek program, which was used to estimats de rate of each abne under each stane of the Tech Inc. is an dectesnio fon Collections Inc. collects pan-dor de and US Rabber manfaction various other ber and plastic prodams Merrill Finch aho maintains a "market por dat wameket weighted fraction of all publicly traded suck you vest in that portfolia, and the chain average stock marke this Whare ruf mik High each beating, and the the below standard deviation the shape of the prodig US. Read T 4. Suppone you bely end p and of ander when the sem being TRACTATIVE INVESTMENTS ESTIMATE TEF RETUR THE CO YMOUS V in Sw Avemp an A JA 199 Nags 84 M A.R A F ca MA Ha High The de muntand dev deed have widely d (2) Why High Texpected whes Collection the e of s - cial planner with Merrill Finch Inc, a large financial servi corporation. Your first assignent is to $100,000 client. Because the funds are to be invened in a busines the end of 1 year, you have been instructed to plan for a 1- year holding period. Furder, your bom has stricted you to expeed banks on the s the table belor decision solely on s pedres is only approprie for rik-nevral ind indoo the following investest shernatives in the table le. You should mengise that haing shown with their probabilities and Dogard for now the ins at the boon of the da; you will fill in the Man in your chevilly everyone, is n aver, the res of each a importa spect of the decision One pomible mature of k andand deviation of (1) Calendare this value each alem, and fill in the bank the table below Whar pe of risk is measured by and dev0) Des graph that shows g edhe shape of the piny d Merrill Finck's cooponie forecasting maff has developed probability estimates for the state of the economy and in security analyses have developed a sophisticated computer program, which was used to estimate the rease of on each shemative under each one of the economy. High Tech Inc. is an electronics fem Collections Inc. pat-dor deles, and US Rabber manufactures tires and various other rubber and plastic products. Merrill Fach sho maintains a "market port that we market weighted fraction of all publicly traded ocks vest in that portfolio, and thus obtain average stock US Rabber and T-k be & Suppo you suddenly membered that the coffin vation (CV) y repedel surf when the are being TURNS ON ALTERNATIVE WRESTMENTS ESTIMATES RATE OF RETURN sta o PROSABILITY Re BUITINNG 61 Below eng 3625 N Bon CV s Dhe de CV p deviation Cada d w b) How d mpart 42 M Should perde Cal ped to iden would y that could you your nk that you e The expected the M SPS 60 40 40 11 - On 110 19 CYBER PROBLEM + a z. , a n MN ME 30000
Step by Step Solution
There are 3 Steps involved in it

Get step-by-step solutions from verified subject matter experts