

Question: AWN Risk Return Template 5 a. Use the data given to calculate annual returns for Bartman, Reynolds, and the Market Index, and then calculate average
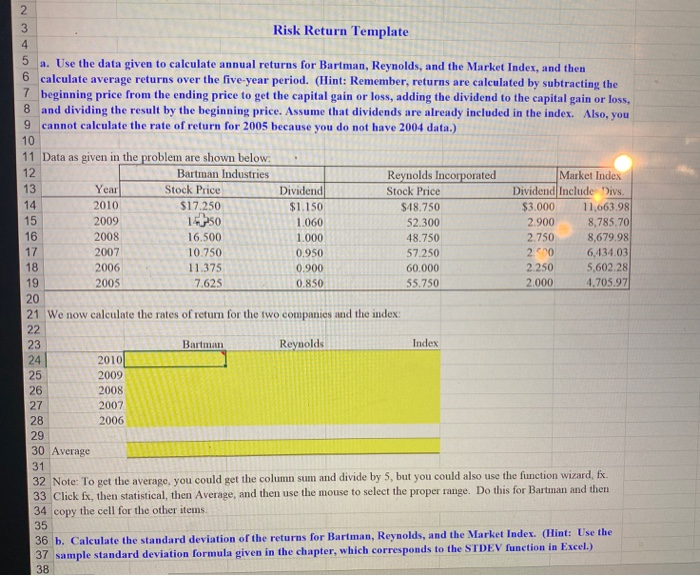
AWN Risk Return Template 5 a. Use the data given to calculate annual returns for Bartman, Reynolds, and the Market Index, and then calculate average returns over the five-year period. (Hint: Remember, returns are calculated by subtracting the 7 beginning price from the ending price to get the capital gain or loss, adding the dividend to the capital gain or loss, 8 and dividing the result by the beginning price. Assume that dividends are already included in the index. Also, you 9 cannot calculate the rate of return for 2005 because you do not have 2004 data.) 10 11 Data as given in the problem are shown below: Bartman Industries Reynolds Incorporated Market Index Year Stock Price Dividend Stock Price Dividend Include Divs. 2010 $17.250 $1.150 $48.750 $3.000 11,663.98 2009 1350 1.060 52.300 2.900 8,785.70 2008 16.500 1.000 48.750 2.750 8,679.98 2007 10.750 0.950 57.250 2.000 6,434.03 2006 11.375 0.900 60.000 2.250 5,602.28 2005 7.625 0.850 55.750 2.000 4.705.97 21 We now calculate the rates of return for the two companies and the index: Bartman Reynolds Index 20101 2009 2008 2007 2006 30 Average 32 Note: To get the average, you could get the column sum and divide by 5, but you could also use the function wizard, fx 33 Click fx, then statistical, then Average, and then use the mouse to select the proper range. Do this for Bartman and then 34 copy the cell for the other items. 35 36 b. Calculate the standard deviation of the returns for Bartman, Reynolds, and the Market Index. (Hint: Use the 37 sample standard deviation formula given in the chapter, which corresponds to the STDEV function in Excel.) 38
Step by Step Solution
There are 3 Steps involved in it

Get step-by-step solutions from verified subject matter experts