

Question: Answers are given in blue. Please solve using excel functions and I'll rate up Considerthe folloWing hypothesis statement using oC=D.D1 and data from two independent
Answers are given in blue. Please solve using excel functions and I'll rate up
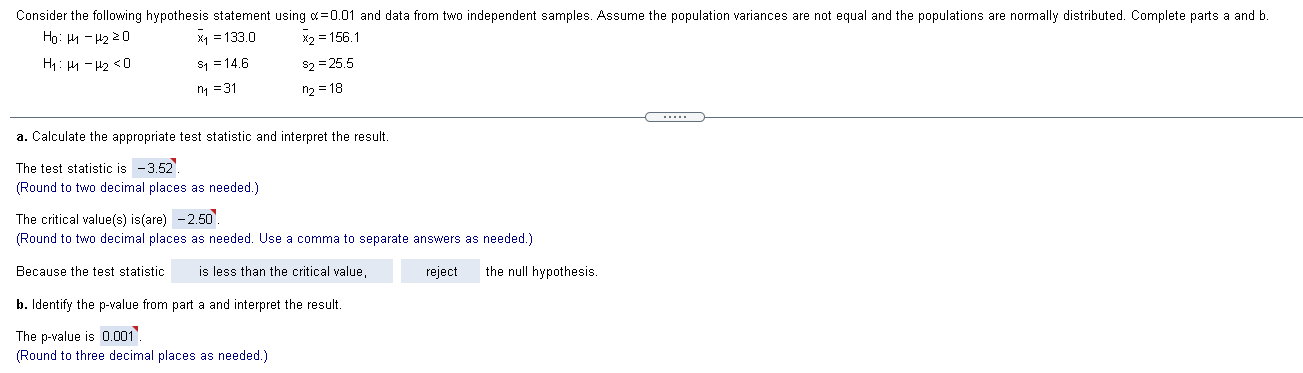
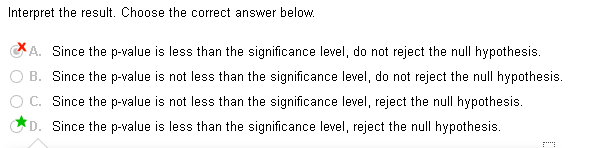
Considerthe folloWing hypothesis statement using oC=D.D1 and data from two independent samples. Assume the population variances are not equal and the populations are normally distributed. Complete parts a and b. HUSH/(*LLQZU x1=133|3 x2=1551 Hypnipzj s1=ME s2=255 n1 =31 n2 =18 3. Calculate the appropriate test statistic and interpret the result. The test statistic is 3.52'. (Round to two deCimal places as needed.) The critical value(s) is(are) 2 ED' (Round to two decimal places as needed. Use a comma to separate answers as needed.) Because the test statistic is less than the critical value, reject the null hypothesis. [1. ldentity the p-value from part a and interpret the result The p-value is UDUT' (Round to three deCimal places as needed.) Interpret the result. Choose the correct answer below. A. Since the p-value is less than the significance level, do not reject the null hypothesis. O B. Since the p-value is not less than the significance level, do not reject the null hypothesis. O C. Since the p-value is not less than the significance level, reject the null hypothesis. D. Since the p-value is less than the significance level, reject the null hypothesis
Step by Step Solution
There are 3 Steps involved in it

Get step-by-step solutions from verified subject matter experts