

Question: Answers are given in blue. Please solve using excel functions. Consider the followmg hypothesis statement using 06:8.05 and data from two Independent samples Assume the
Answers are given in blue. Please solve using excel functions.
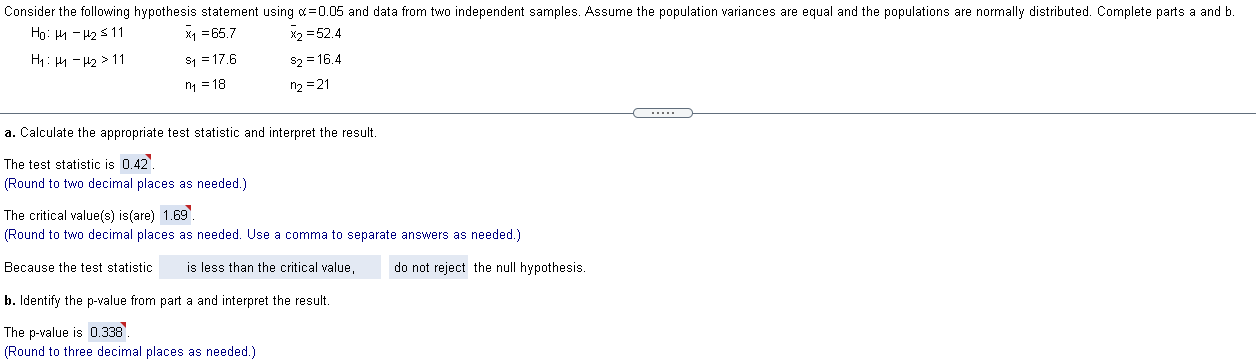
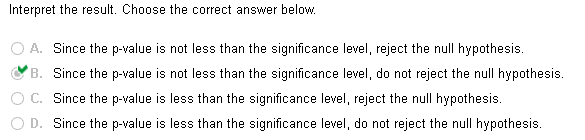
Consider the followmg hypothesis statement using 06:8.05 and data from two Independent samples Assume the population variances are equal and the populations are normally distributed. Complete parts a and b. ngmiugs ;1 =55] 2=524 H1p4u2>1l 51:1?5 322184 n1 =15 n2 =21 a. Calculate the appropriate test statistic and interpret the result. The test statistic is 0.42'. (Round to two decimal places as needed.) The critical value(s) is(are) 1.59'. (Round to two decimal places as needed. Use a comma to separate answers as needed.) Because the test statistic is less than the critical value, do not reject the null hypothesis. [3. identify the p-value from pan a and interpret the result. The p-value is osss'. (Round to three decimal places as needed) \f
Step by Step Solution
There are 3 Steps involved in it

Get step-by-step solutions from verified subject matter experts