

Question: (Answers for all given questions (b-f) to compare for notes) The following Table describes the labor market for the whole economy of a given country.
(Answers for all given questions (b-f) to compare for notes)
The following Table describes the labor market for the whole economy of a given country. Assume perfect and full information is available to every participant in this economy, factors of production are perfectly mobile, prices and wages are perfectly flexible, and perfect competition prevails in all markets.
b) Find the full employment real GDP, aggregate quantity supplied AQS , and nominal wage for each of the following price levels P = 1, 2 ,3, 4. Does the equilibrium levels of employment and
AQS change as the price level changes? Is the long run aggregate supply curve downward or upward sloping or is it a vertical line?
Suppose that the velocity of money is constant V = 5 and the money supply is M s = 80.
c) For each one of the following levels P = 1, 2, 3, 4 and 5, find the aggregate quantity demanded AQD according to the quantity theory. Plot for yourself the corresponding aggregate demand curve on the same diagram as the long run aggregate supply curve. You need to submit the schedule of the Aggregate demand curve. What is the equilibrium price level, the equilibrium real GDP, equilibrium aggregate quantity AQS and the equilibrium aggregate quantity demanded? What is the equilibrium nominal wage?
Suppose now that V = 5 does not change but the money supply decreases to M s = 60.
d) What is the new equilibrium price, and the new equilibrium real GDP? What is the new equilibrium
nominal wage? What happened to the equilibrium price level P and the equilibrium nominal wage?
e) comparing your answers to c) and d) what happened to the equilibrium real GDP, and
employment?
f) Are your answers to the previous two questions consistent with the observed data on the money supply, the price level, nominal wages real GDP and unemployment during the 1929-1933 depression? (Use the relevant diagrams in chapter 20 to justify your answers)
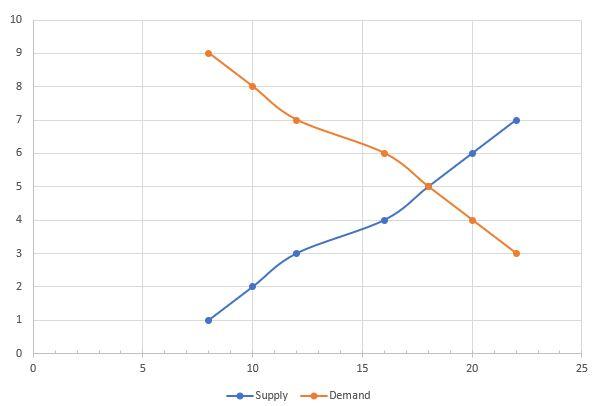
10 9 8 7 6 5 4 3 2 1 0 0 5 10 15 20 25 Supply Demand 10 9 8 7 6 5 4 3 2 1 0 0 5 10 15 20 25 Supply Demand
Step by Step Solution
There are 3 Steps involved in it

Get step-by-step solutions from verified subject matter experts