

Question: Any help would be appreciated The following table, published in USA Today, lists divorce rates and mobility rates for different regions of the USA. The
Any help would be appreciated
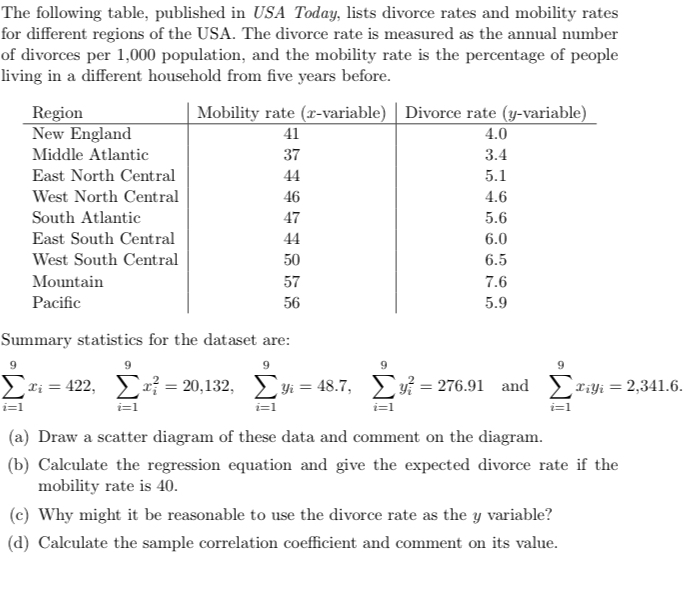
The following table, published in USA Today, lists divorce rates and mobility rates for different regions of the USA. The divorce rate is measured as the annual number of divorces per 1,000 population, and the mobility rate is the percentage of people living in a different household from five years before. Region Mobility rate (r-variable) Divorce rate (y-variable) New England 41 4.0 Middle Atlantic 37 3.4 East North Central 44 5.1 West North Central 46 4.6 South Atlantic 47 5.6 East South Central 44 6.0 West South Central 50 6.5 Mountain 57 7.6 Pacific 56 5.9 Summary statistics for the dataset are: 9 9 9 9 9 Ti = 422, r, = 20,132, yi = 48.7, y = 276.91 and riyi = 2,341.6. i=1 i=1 1= 1 1= 1 i=1 (a) Draw a scatter diagram of these data and comment on the diagram. (b) Calculate the regression equation and give the expected divorce rate if the mobility rate is 40. (c) Why might it be reasonable to use the divorce rate as the y variable? (d) Calculate the sample correlation coefficient and comment on its value
Step by Step Solution
There are 3 Steps involved in it

Get step-by-step solutions from verified subject matter experts