

Question: AnyLogic Simulation model help: Predator VS Prey. Show the COMPLETED AnyLogic model with the answer to the question in the red box and show your
AnyLogic Simulation model help: Predator VS Prey.
Show the COMPLETED AnyLogic model with the answer to the question in the red box and show your work, please be very descriptive and helpful! Get a lot of thumbs up for a good answer too! :D
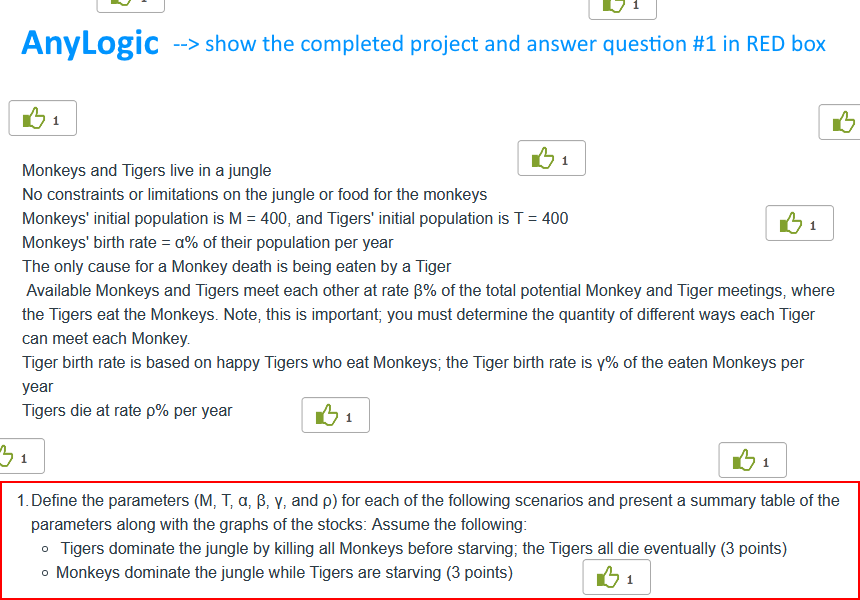
AnyLogic --> show the completed project and answer question #1 in RED box Monkeys and Tigers live in a jungle No constraints or limitations on the jungle or food for the monkeys Monkeys' initial population is M = 400, and Tigers' initial population is T = 400 B1 Monkeys' birth rate = 0% of their population per year The only cause for a Monkey death is being eaten by a Tiger Available Monkeys and Tigers meet each other at rate 3% of the total potential Monkey and Tiger meetings, where the Tigers eat the Monkeys. Note, this is important, you must determine the quantity of different ways each Tiger can meet each Monkey Tiger birth rate is based on happy Tigers who eat Monkeys, the Tiger birth rate is y% of the eaten Monkeys per year Tigers die at rate p% per year 31 1 1. Define the parameters (M, T, A, B, Y, and p) for each of the following scenarios and present a summary table of the parameters along with the graphs of the stocks: Assume the following: o Tigers dominate the jungle by killing all Monkeys before starving; the Tigers all die eventually (3 points) Monkeys dominate the jungle while Tigers are starving (3 points) 0 AnyLogic --> show the completed project and answer question #1 in RED box Monkeys and Tigers live in a jungle No constraints or limitations on the jungle or food for the monkeys Monkeys' initial population is M = 400, and Tigers' initial population is T = 400 B1 Monkeys' birth rate = 0% of their population per year The only cause for a Monkey death is being eaten by a Tiger Available Monkeys and Tigers meet each other at rate 3% of the total potential Monkey and Tiger meetings, where the Tigers eat the Monkeys. Note, this is important, you must determine the quantity of different ways each Tiger can meet each Monkey Tiger birth rate is based on happy Tigers who eat Monkeys, the Tiger birth rate is y% of the eaten Monkeys per year Tigers die at rate p% per year 31 1 1. Define the parameters (M, T, A, B, Y, and p) for each of the following scenarios and present a summary table of the parameters along with the graphs of the stocks: Assume the following: o Tigers dominate the jungle by killing all Monkeys before starving; the Tigers all die eventually (3 points) Monkeys dominate the jungle while Tigers are starving (3 points) 0
Step by Step Solution
There are 3 Steps involved in it

Get step-by-step solutions from verified subject matter experts