

Question: Ap stat 14.02 *No explanation needed a) Inference for regression on the population regression slope B is based on which of the following distributions? The
Ap stat 14.02
*No explanation needed
a)
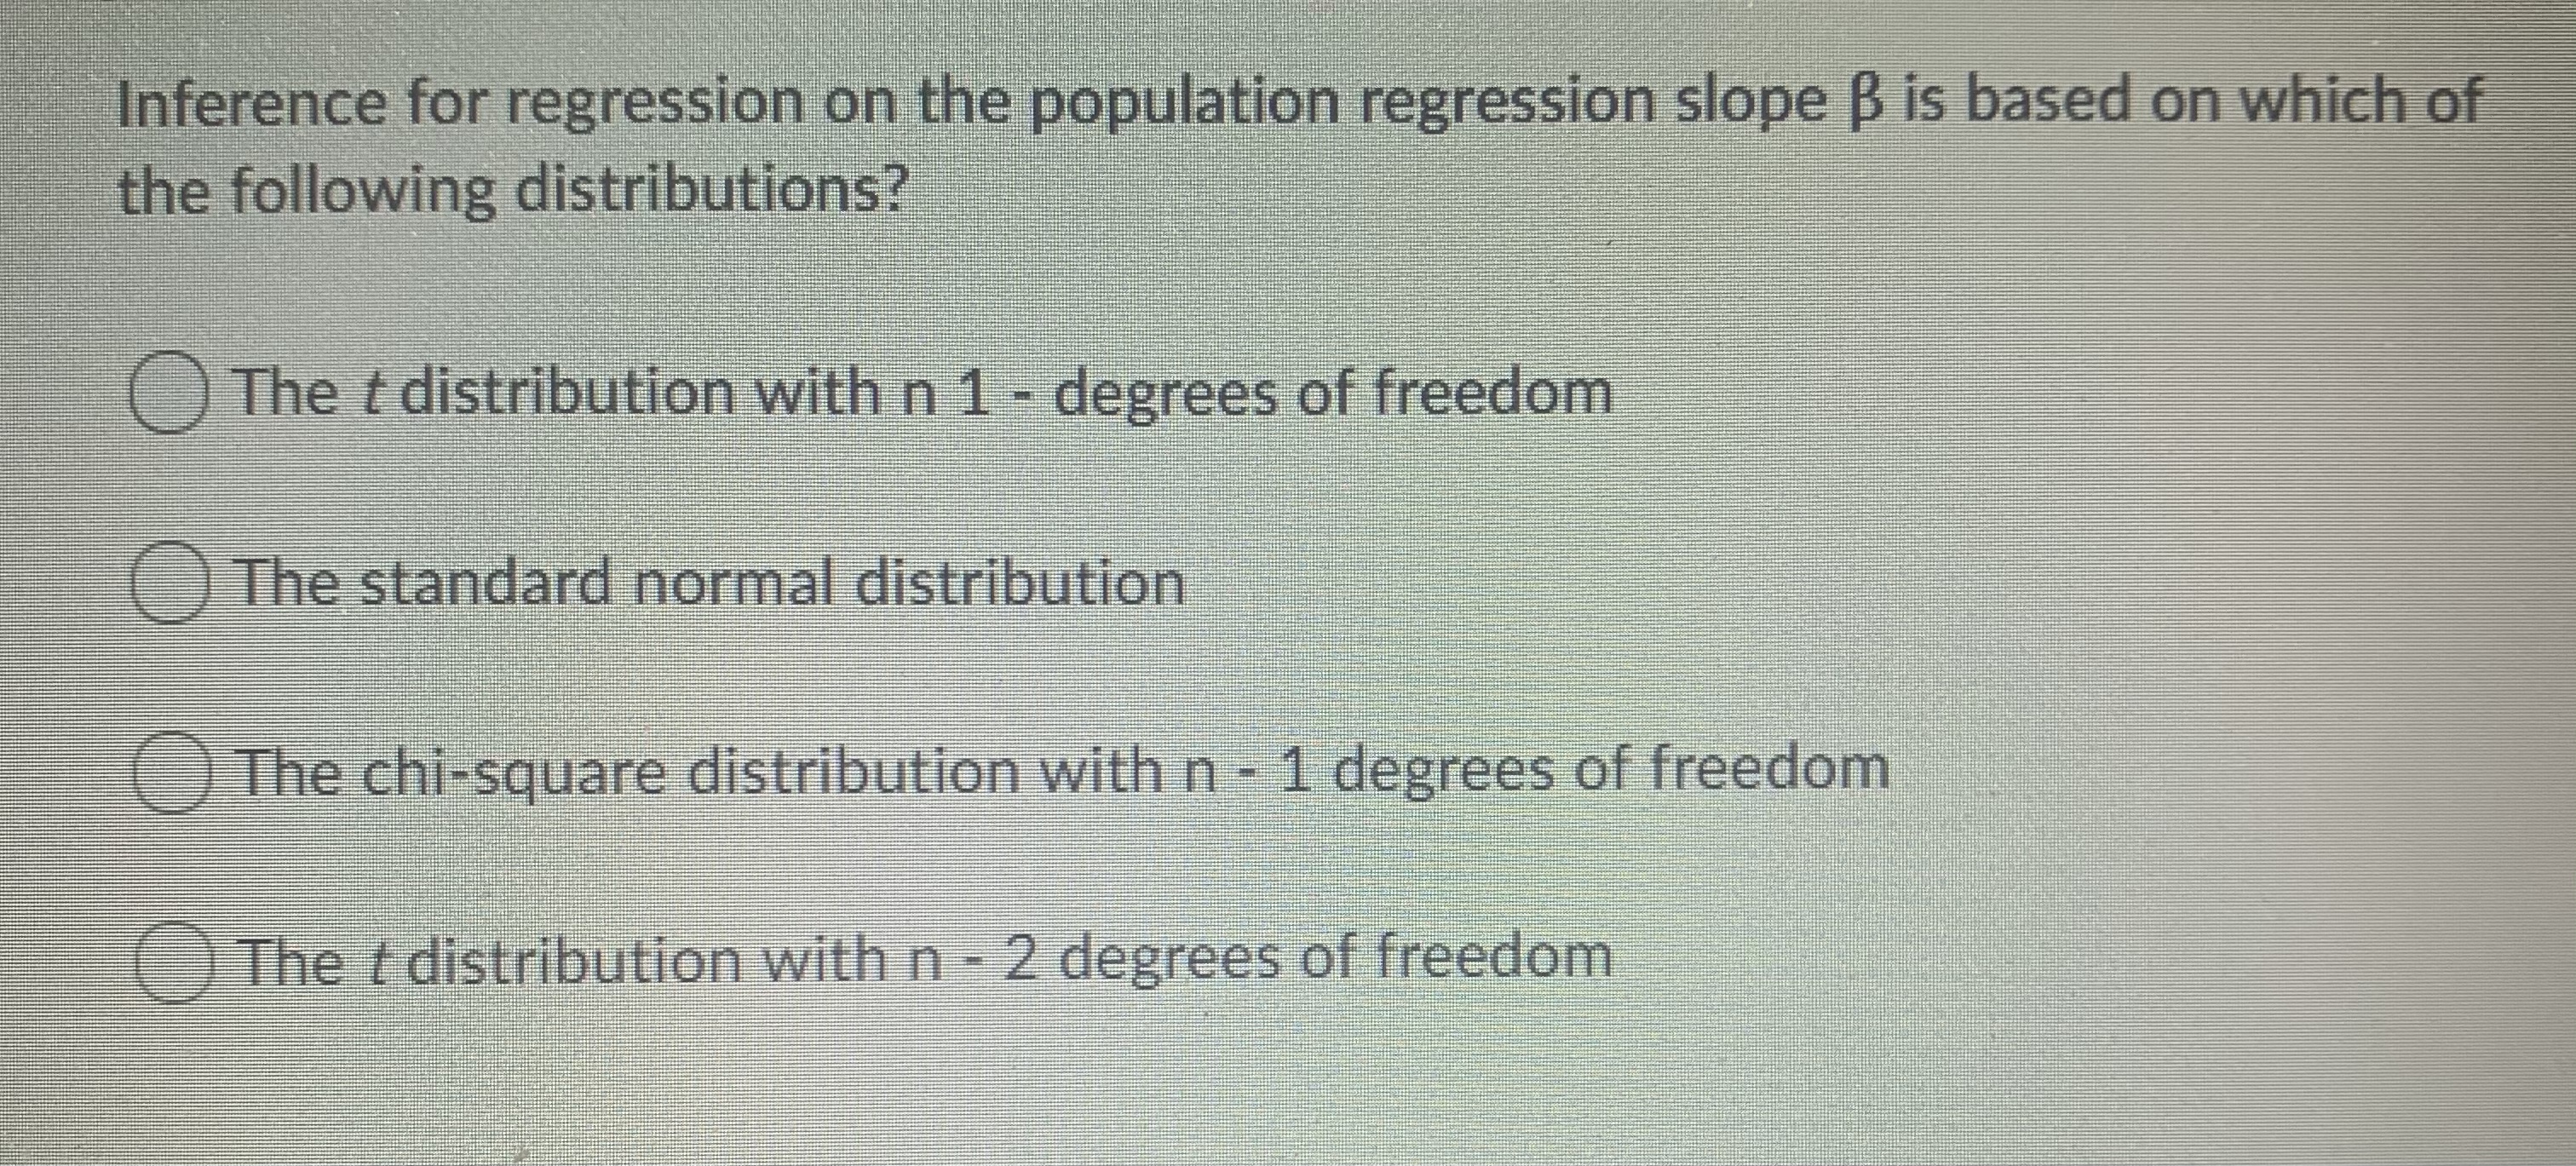
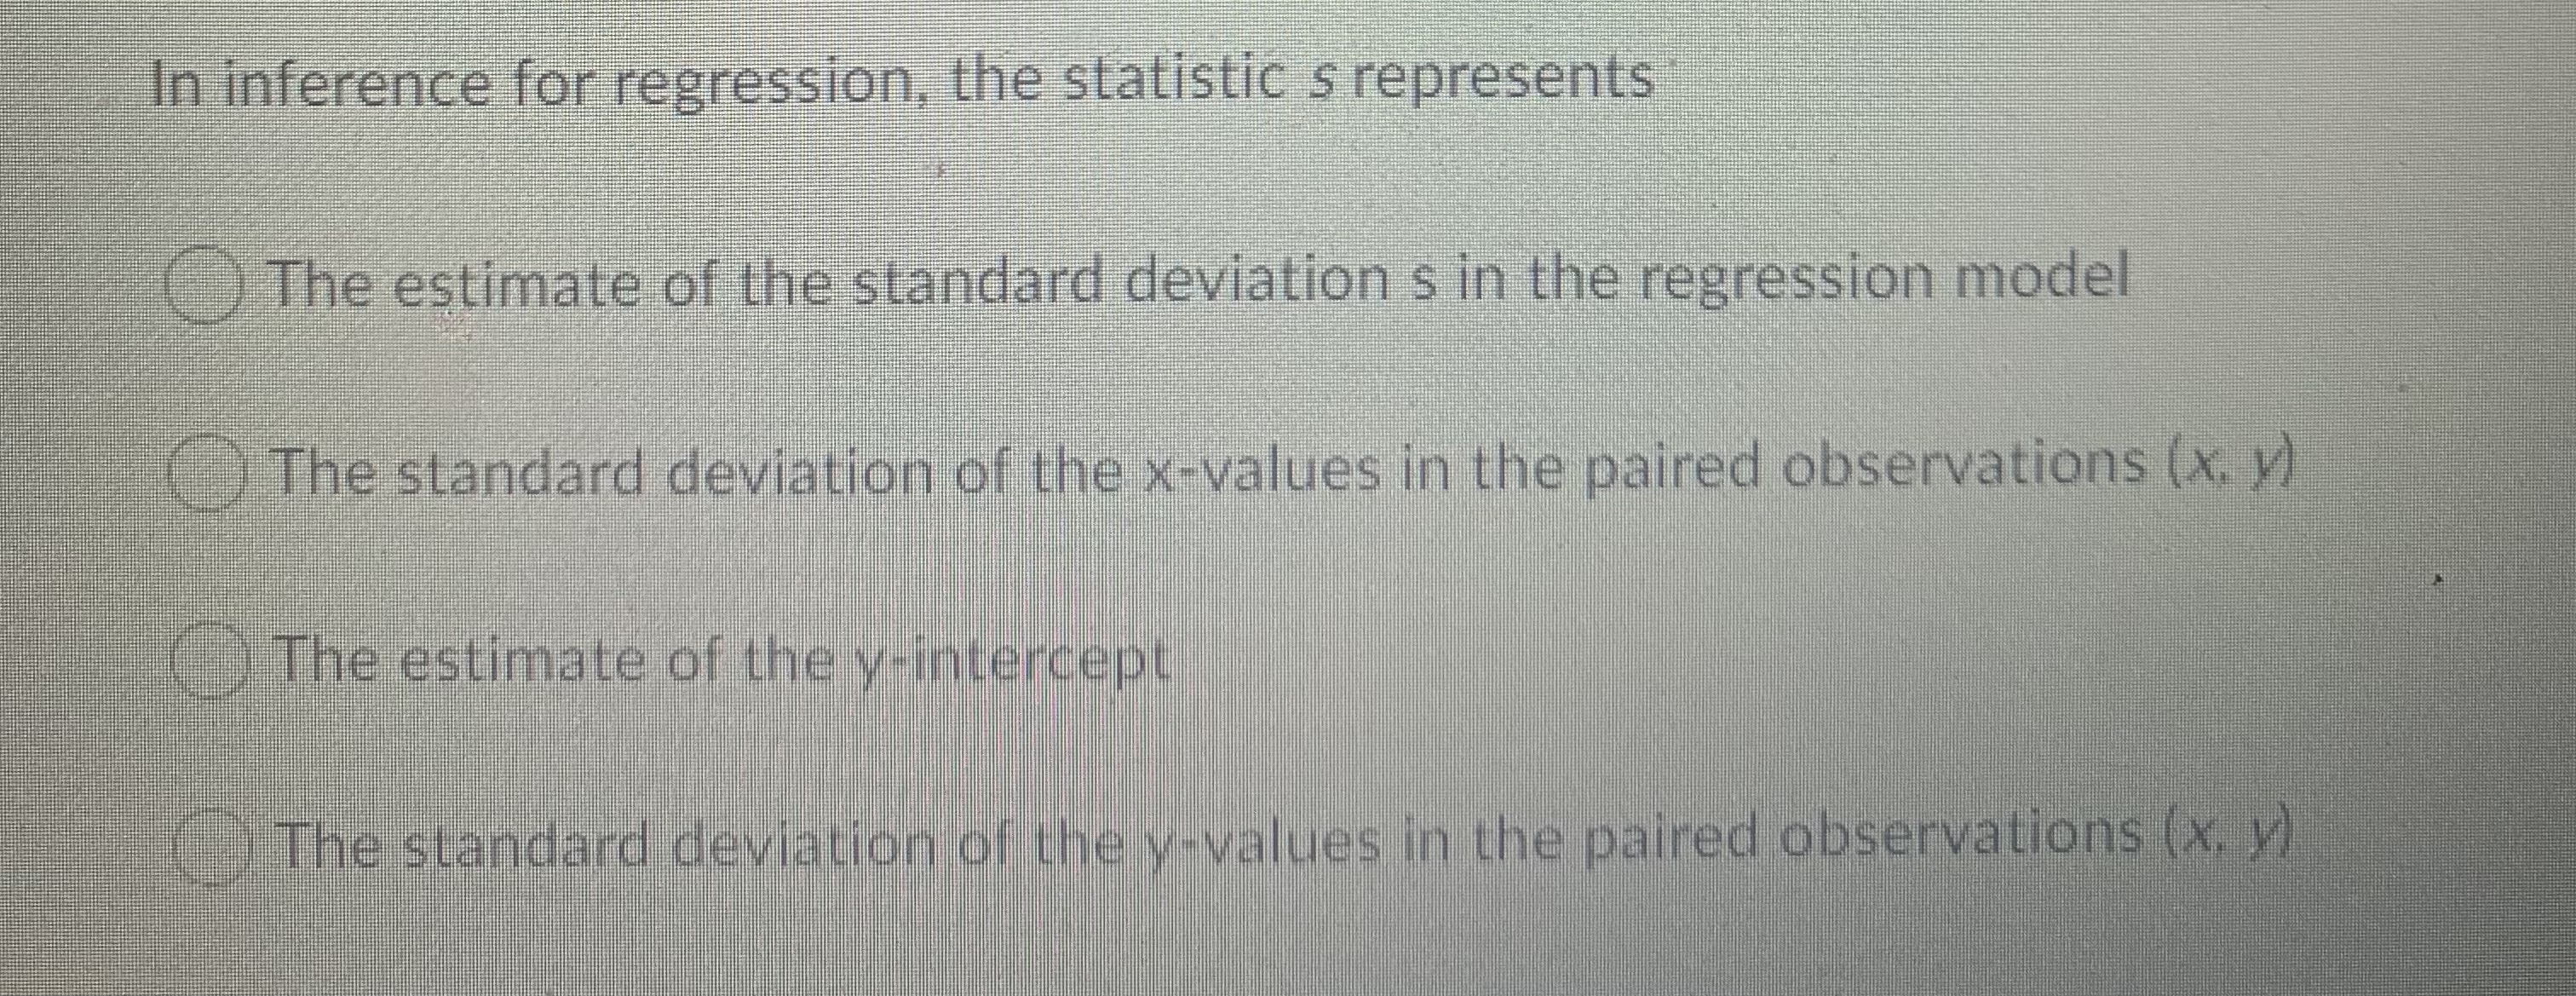
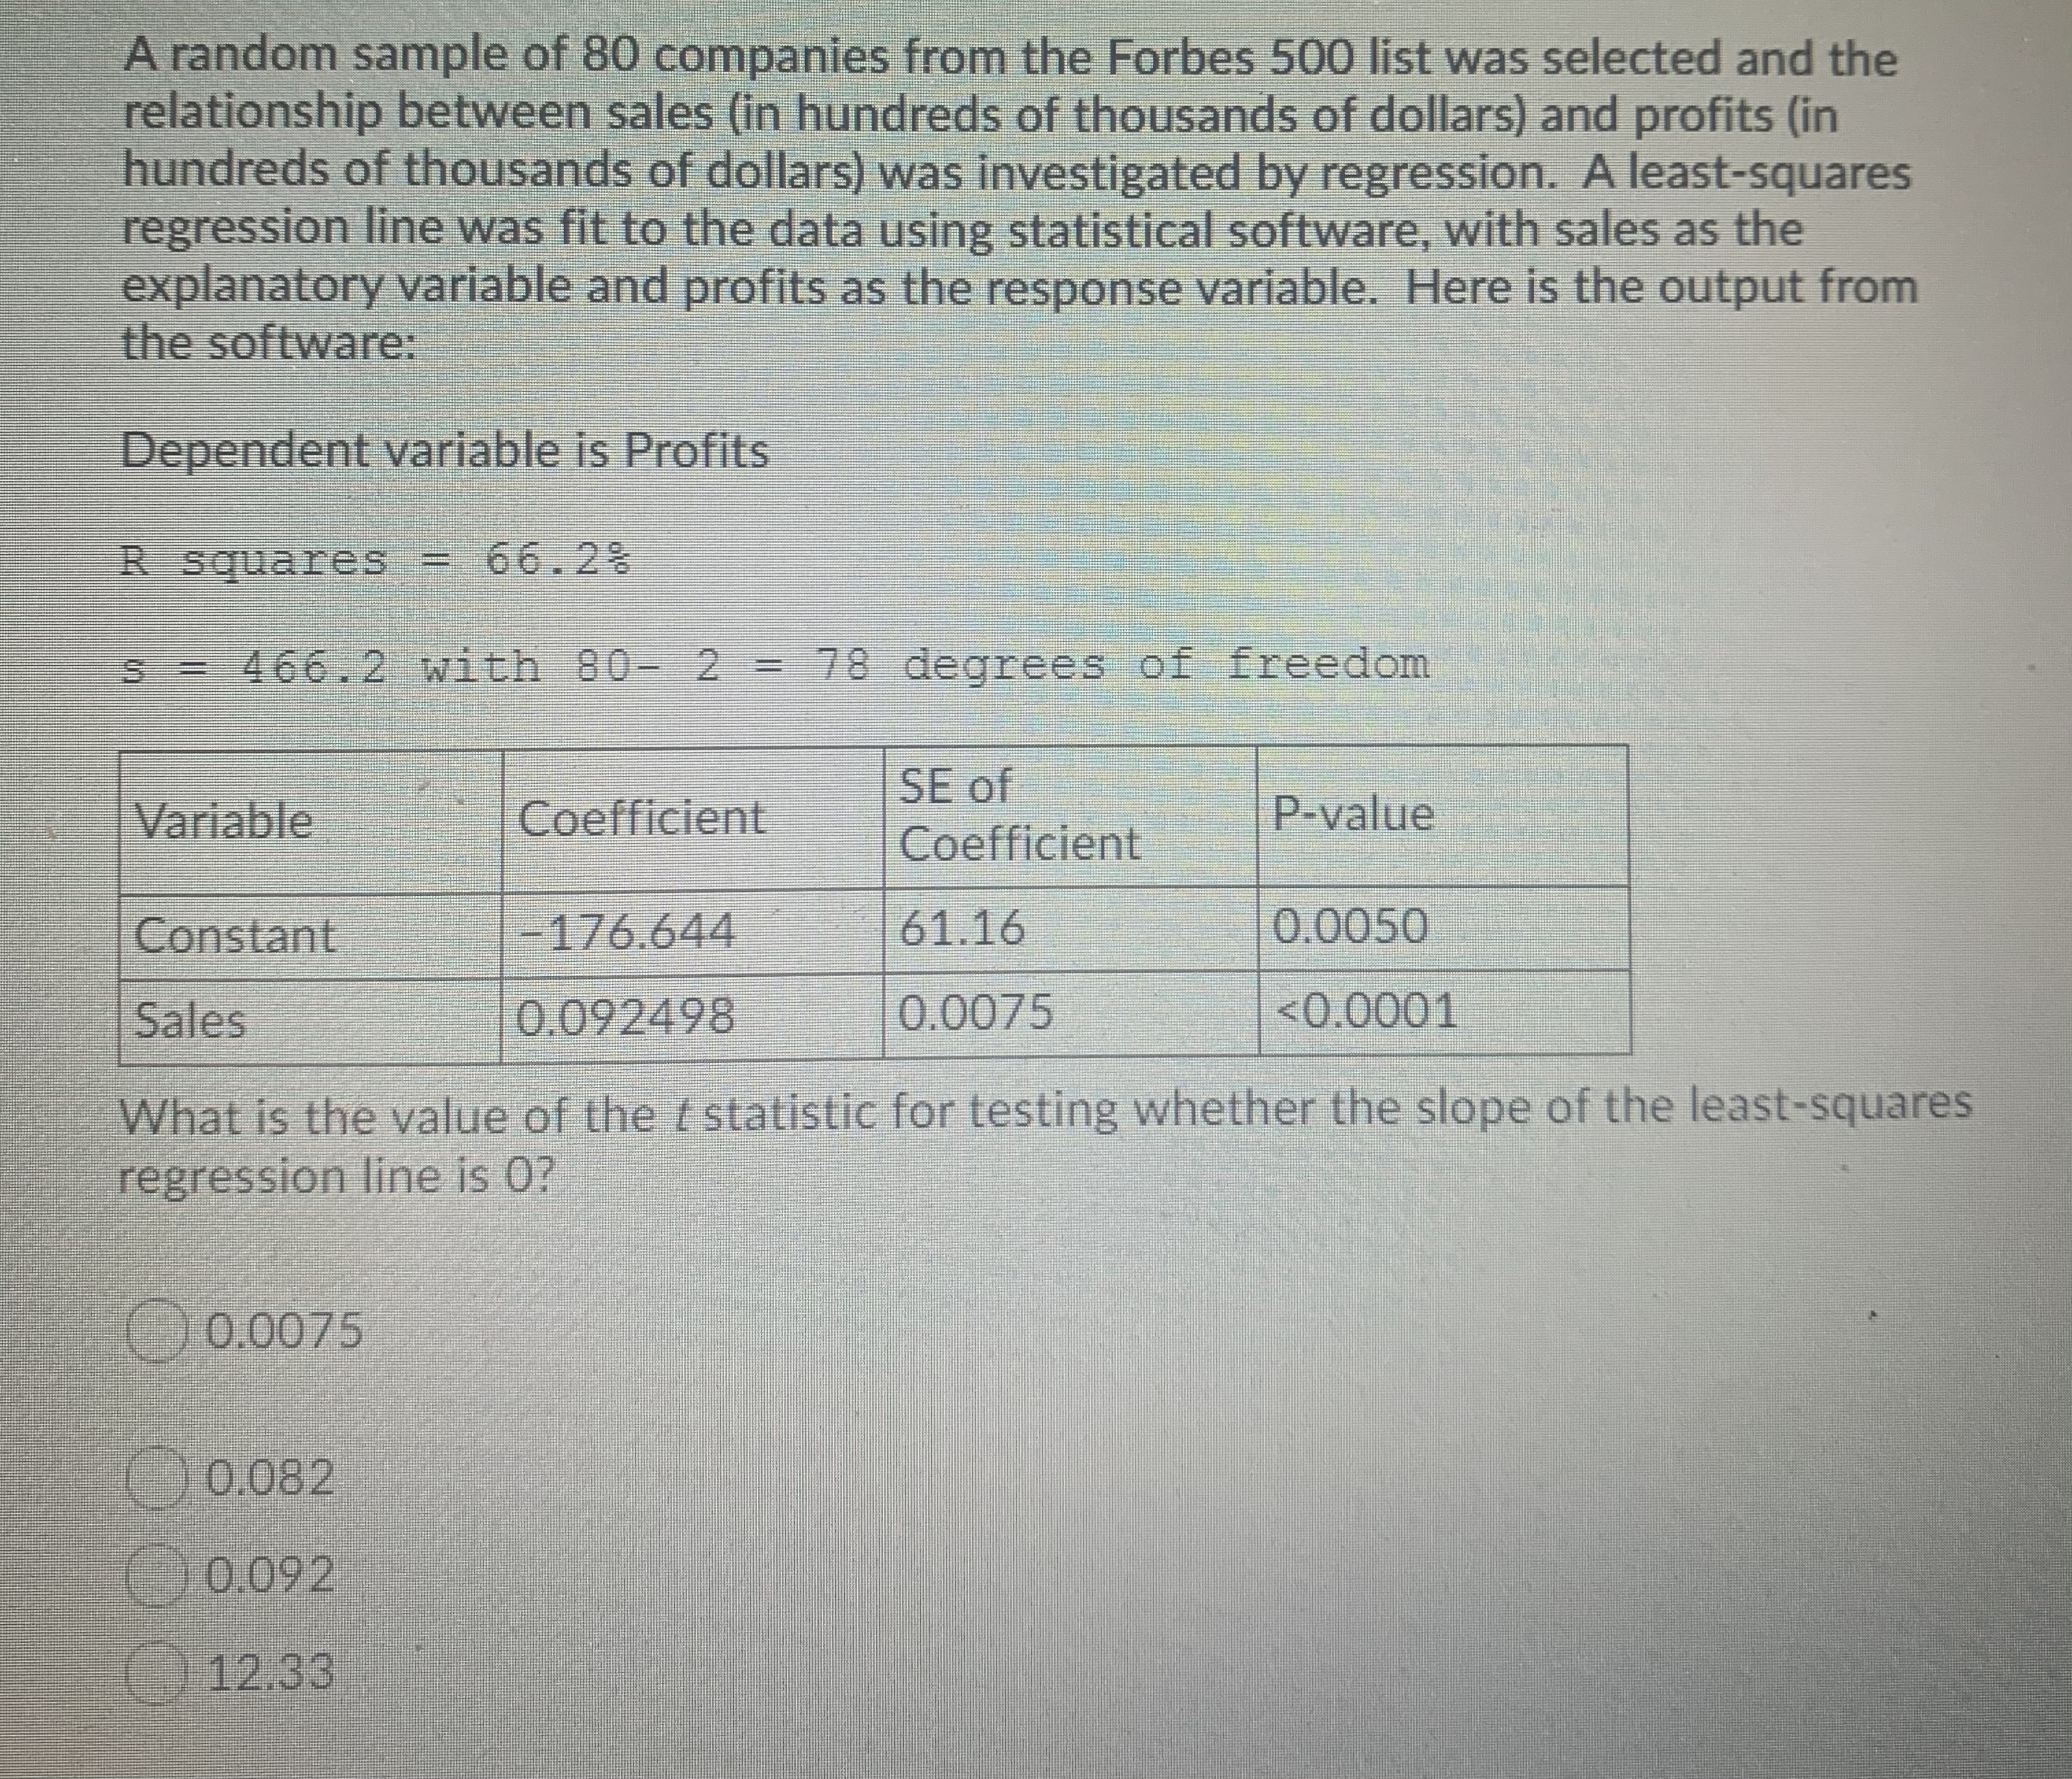
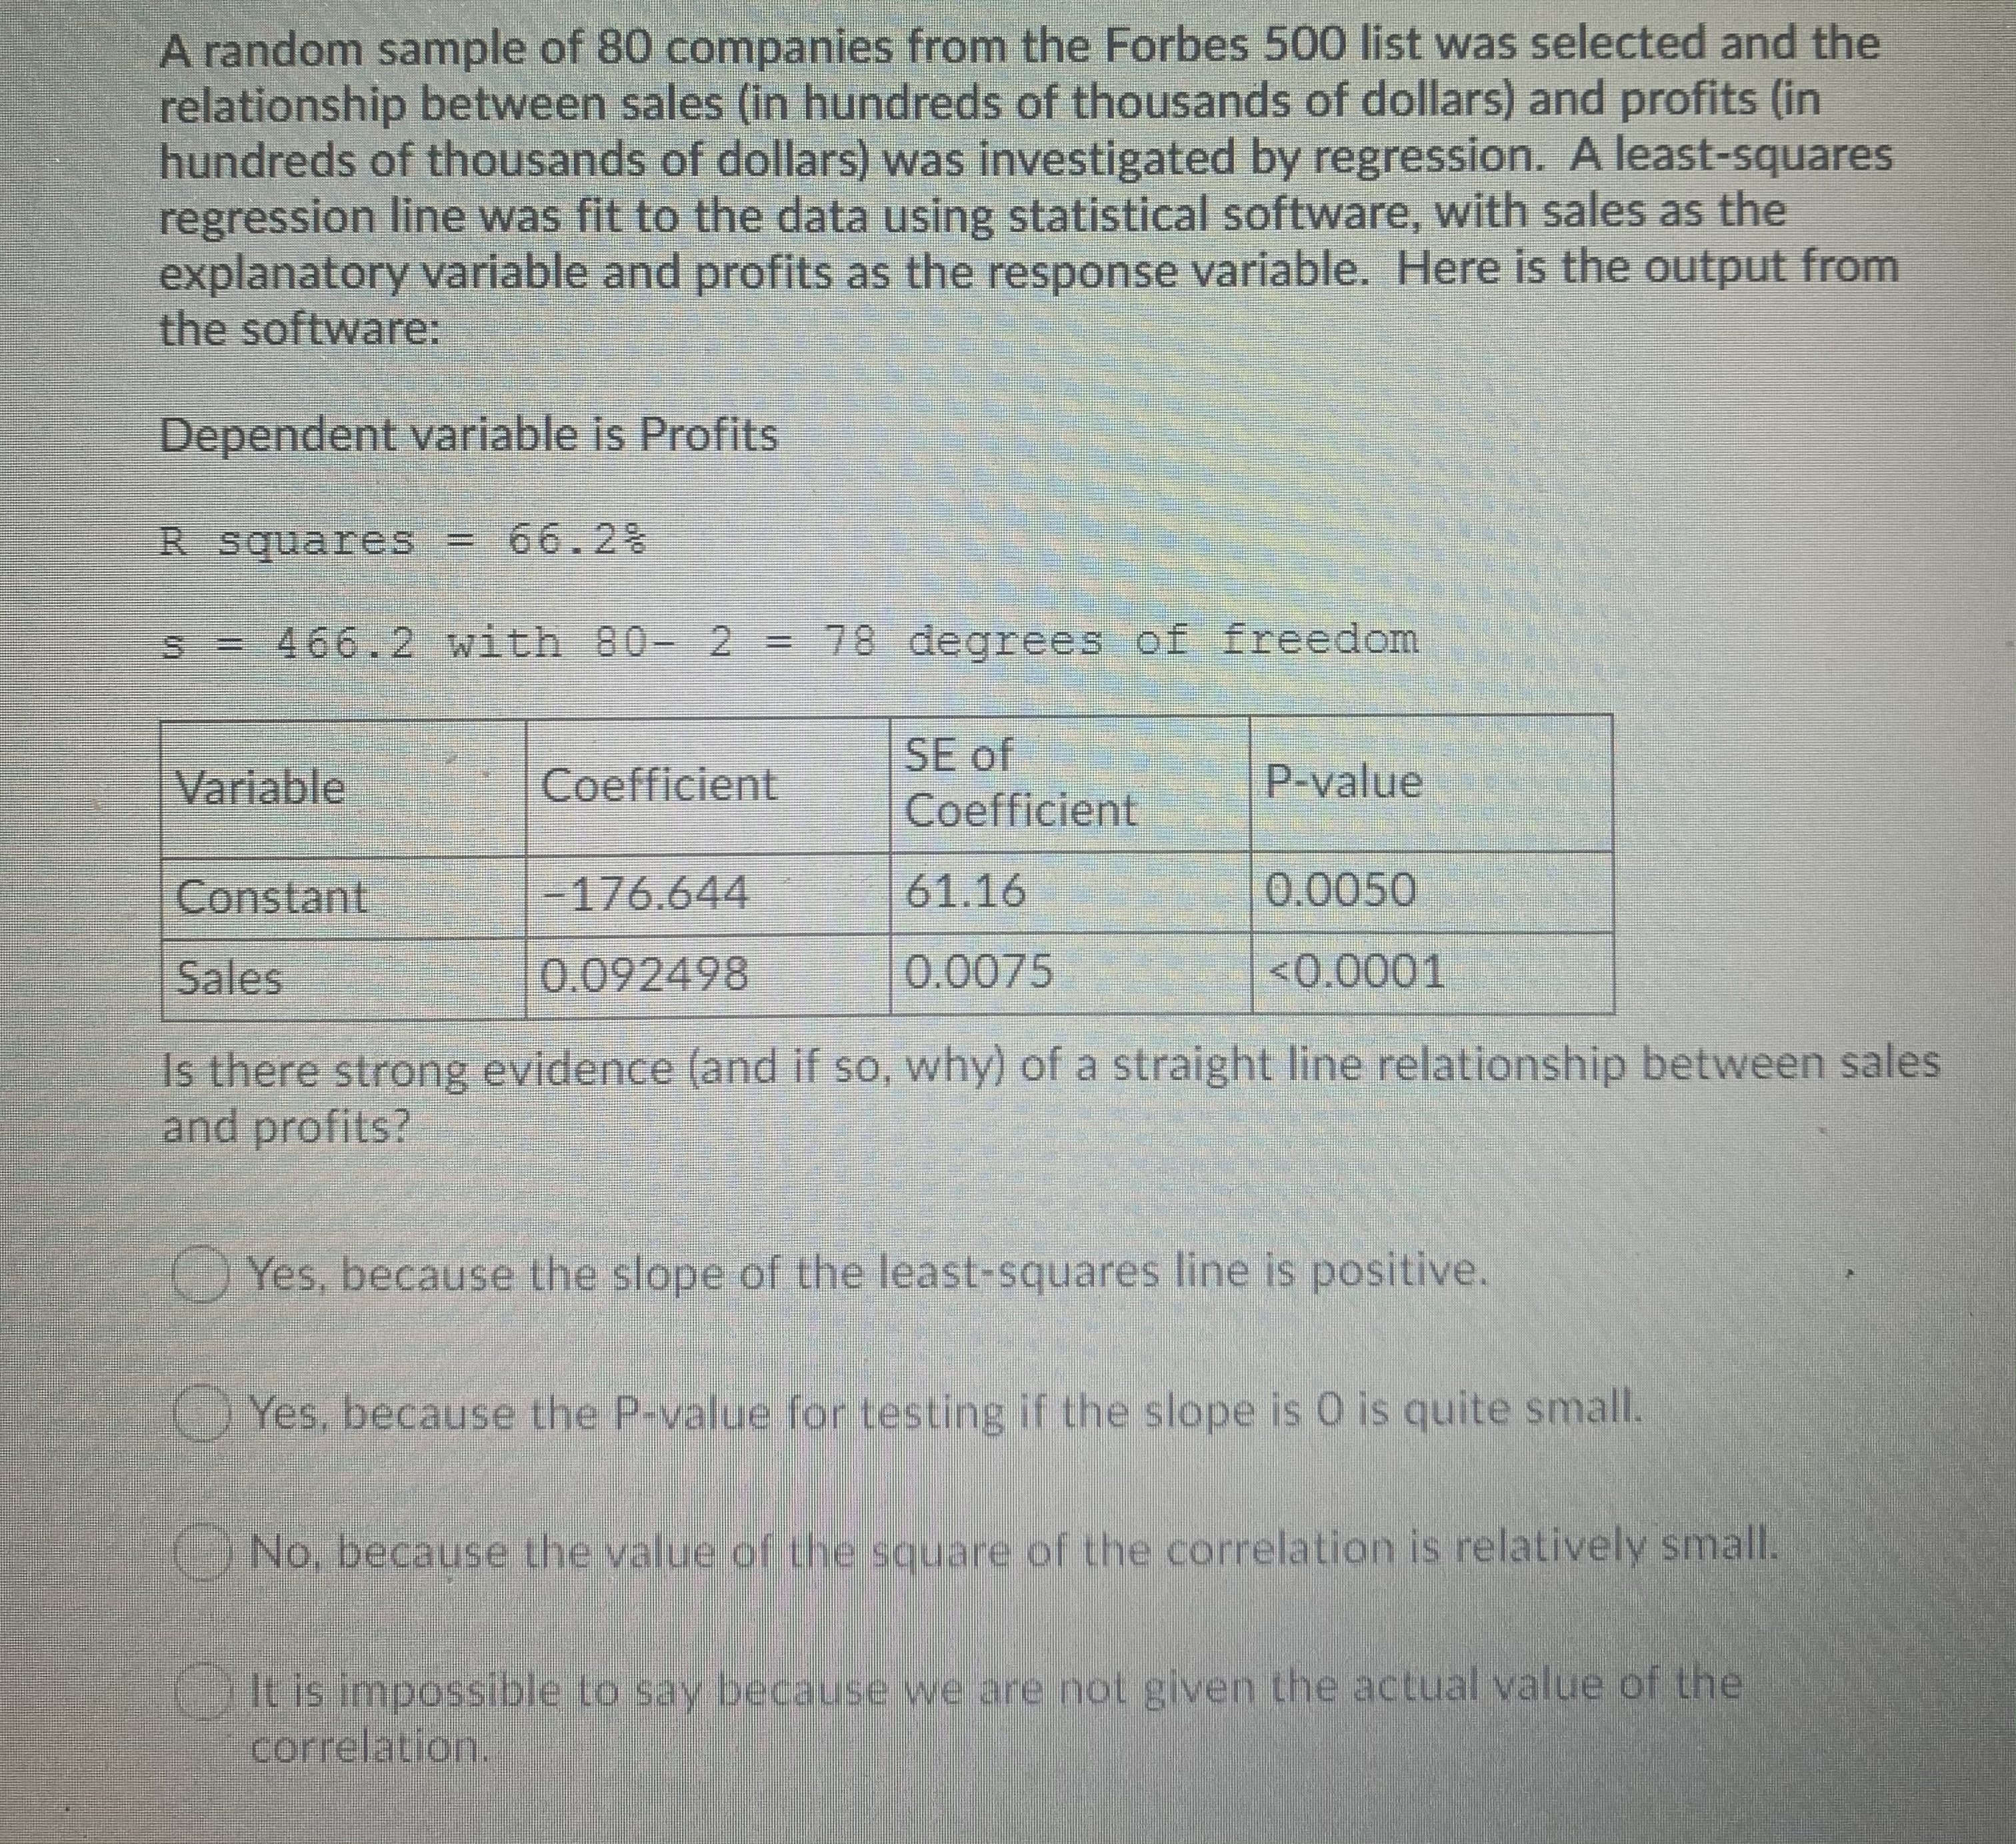
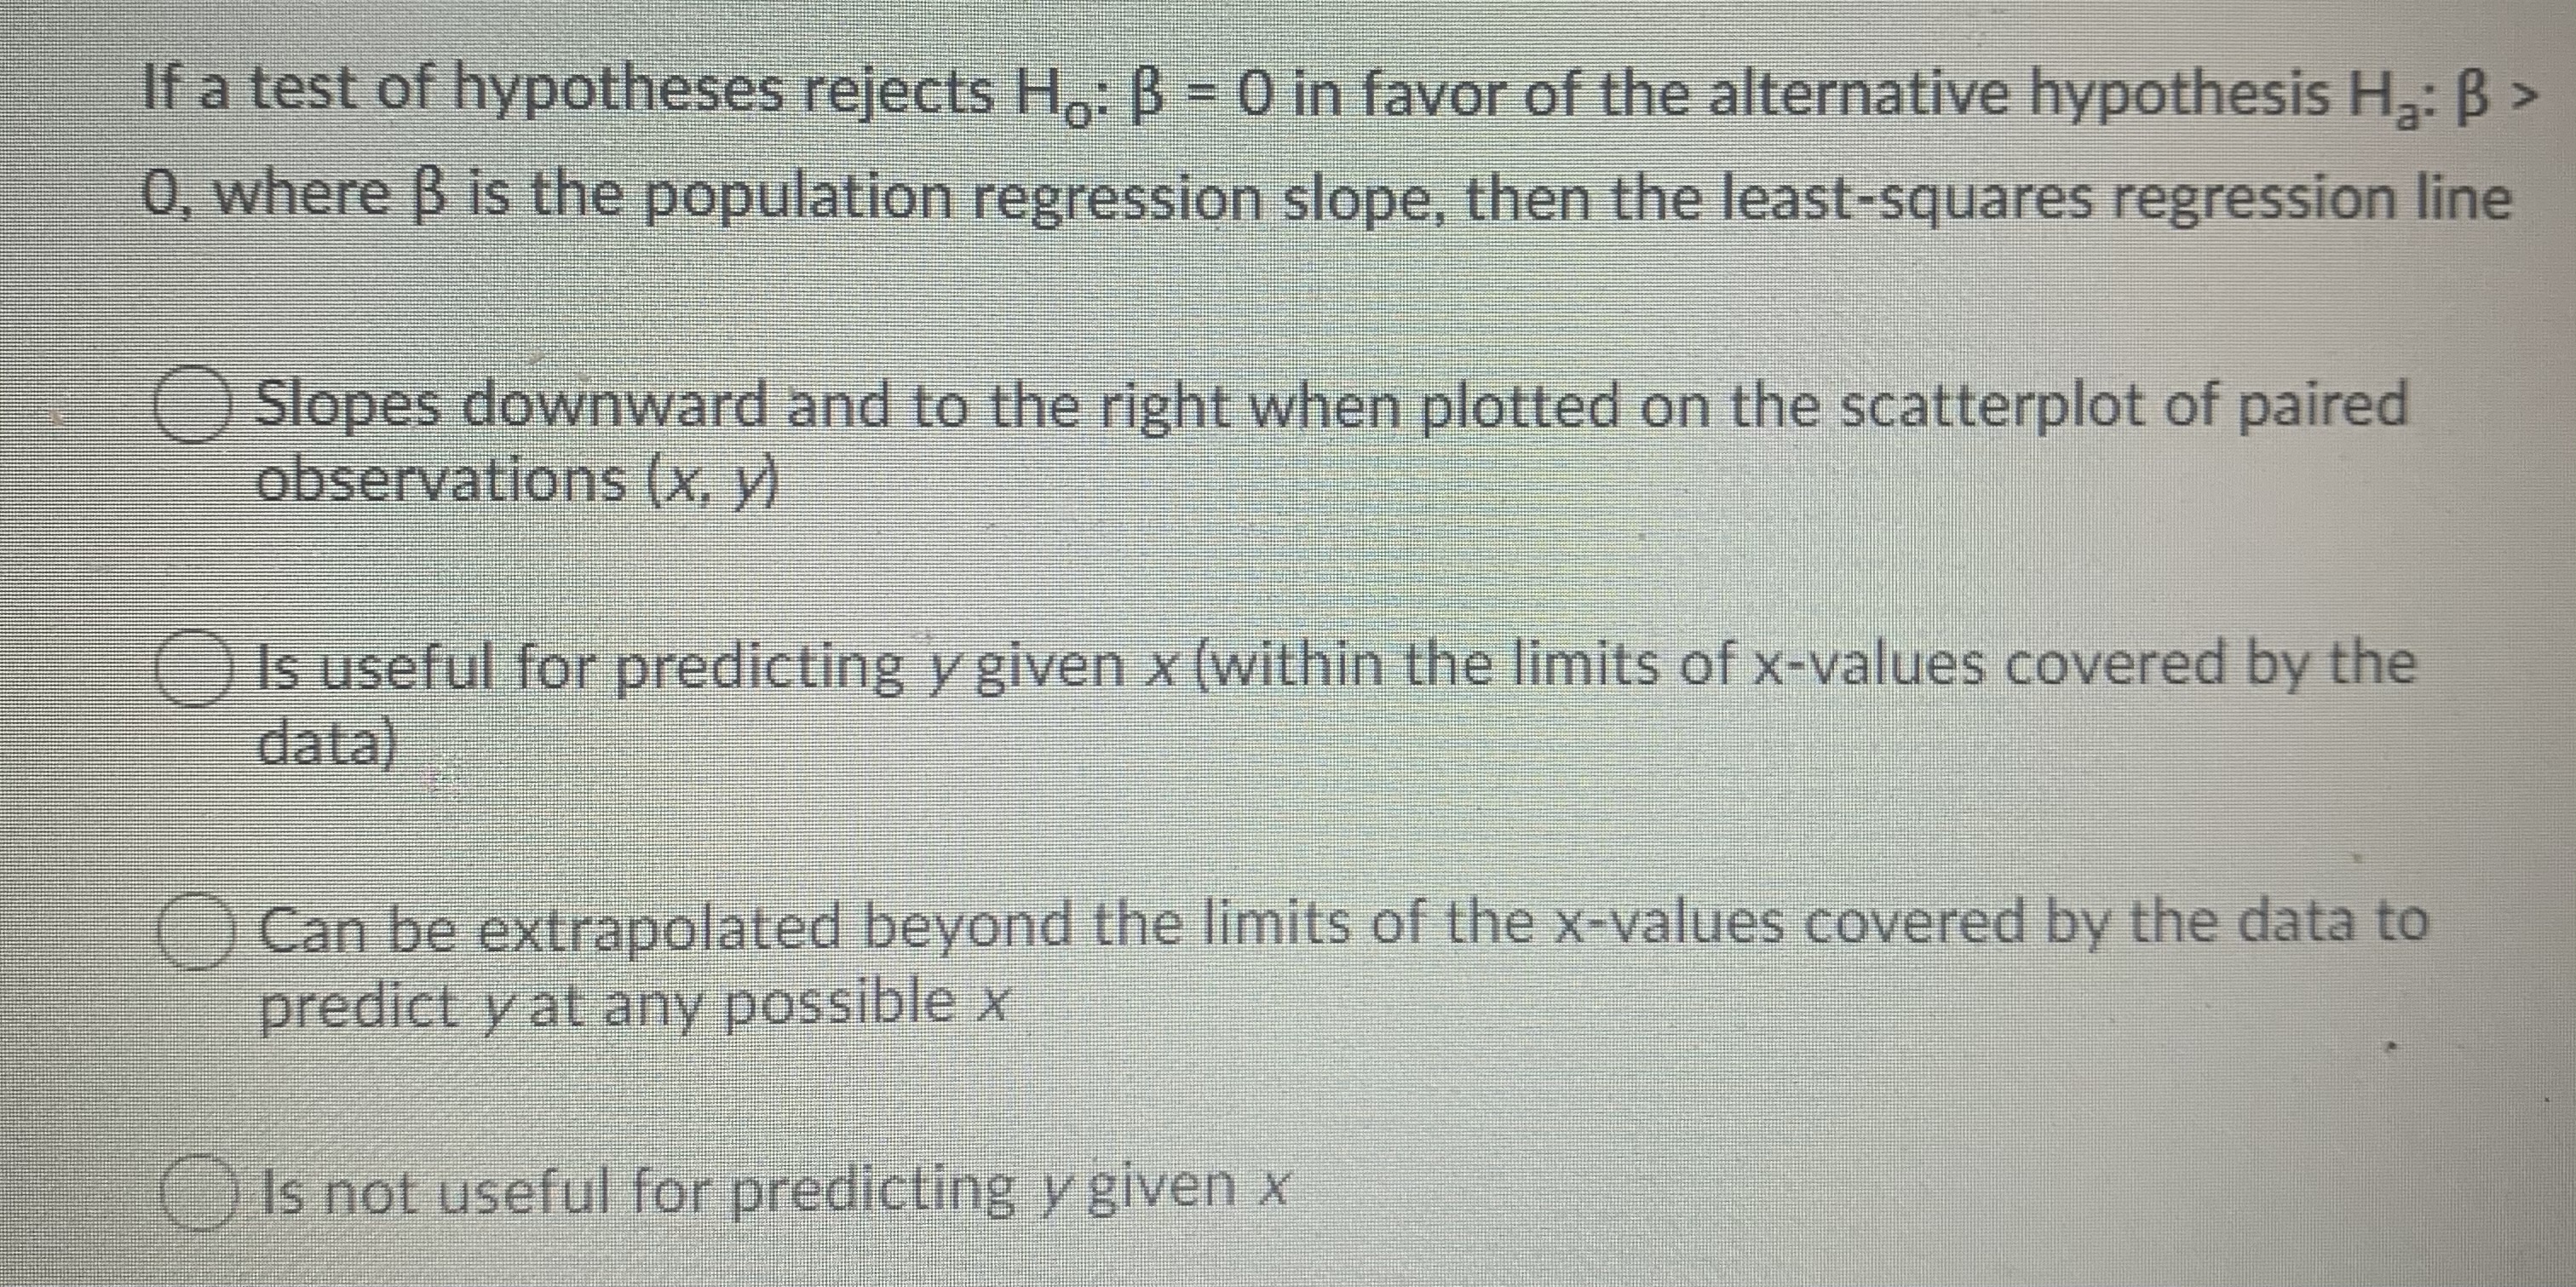
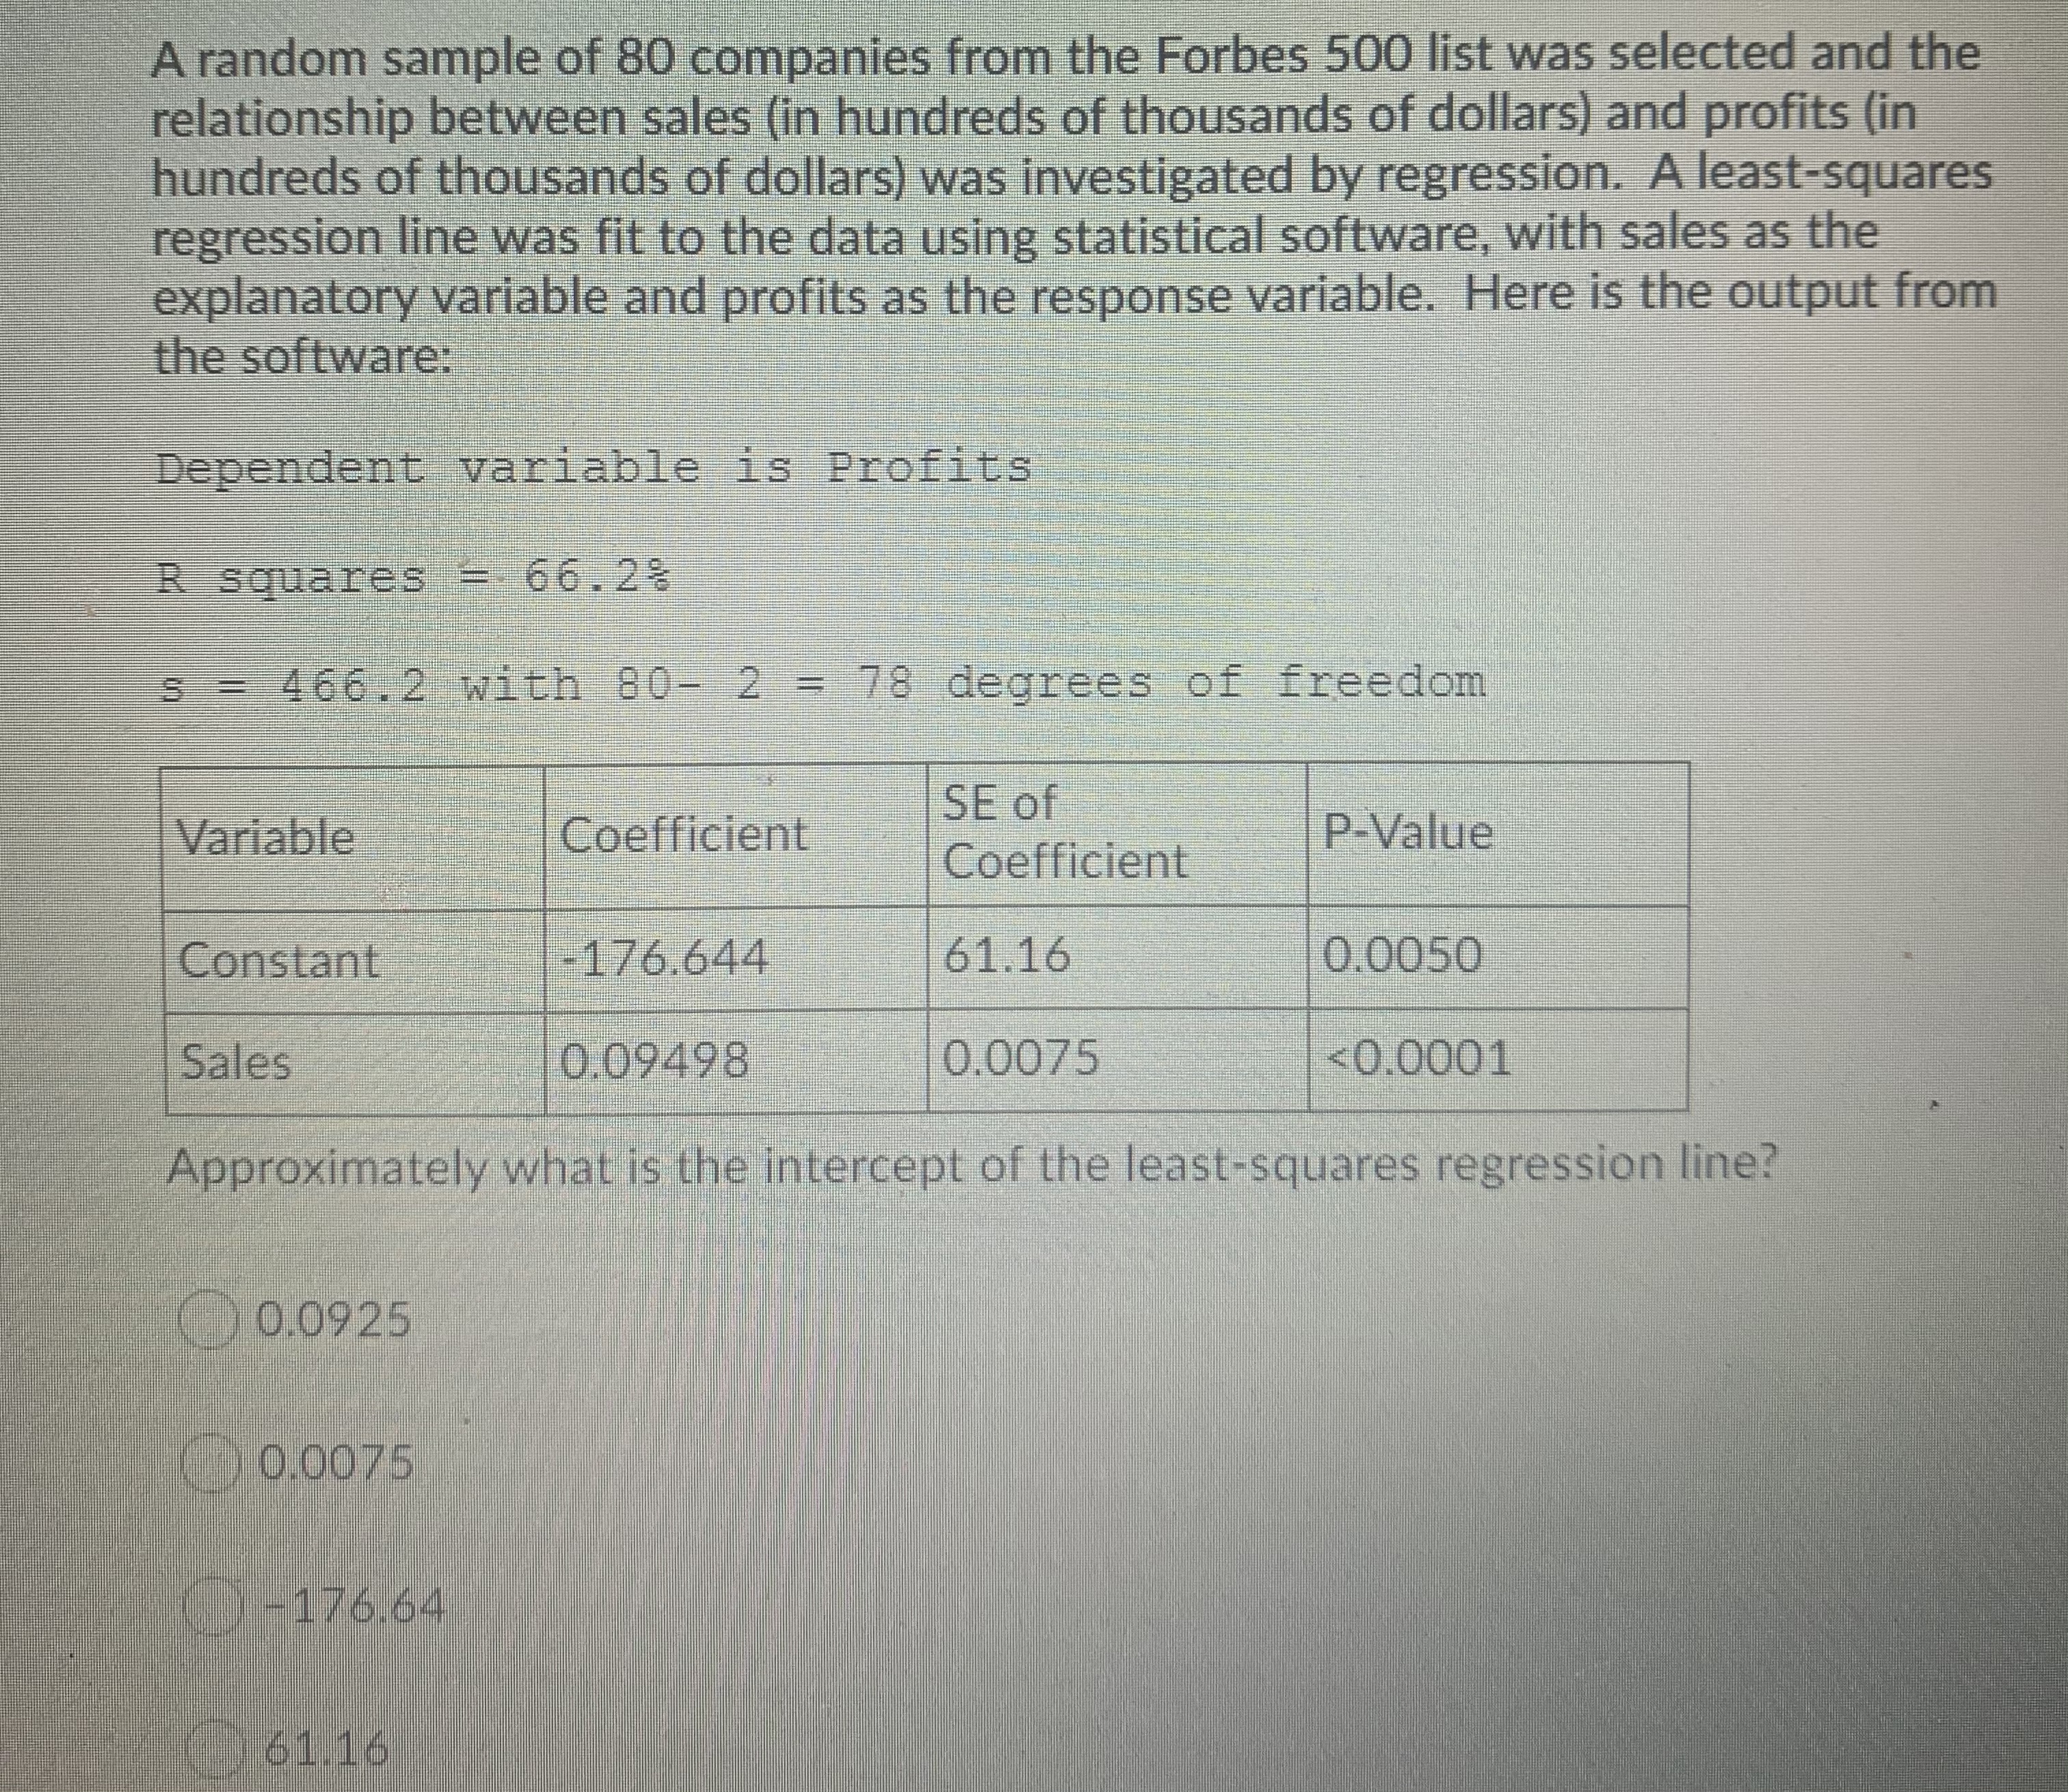
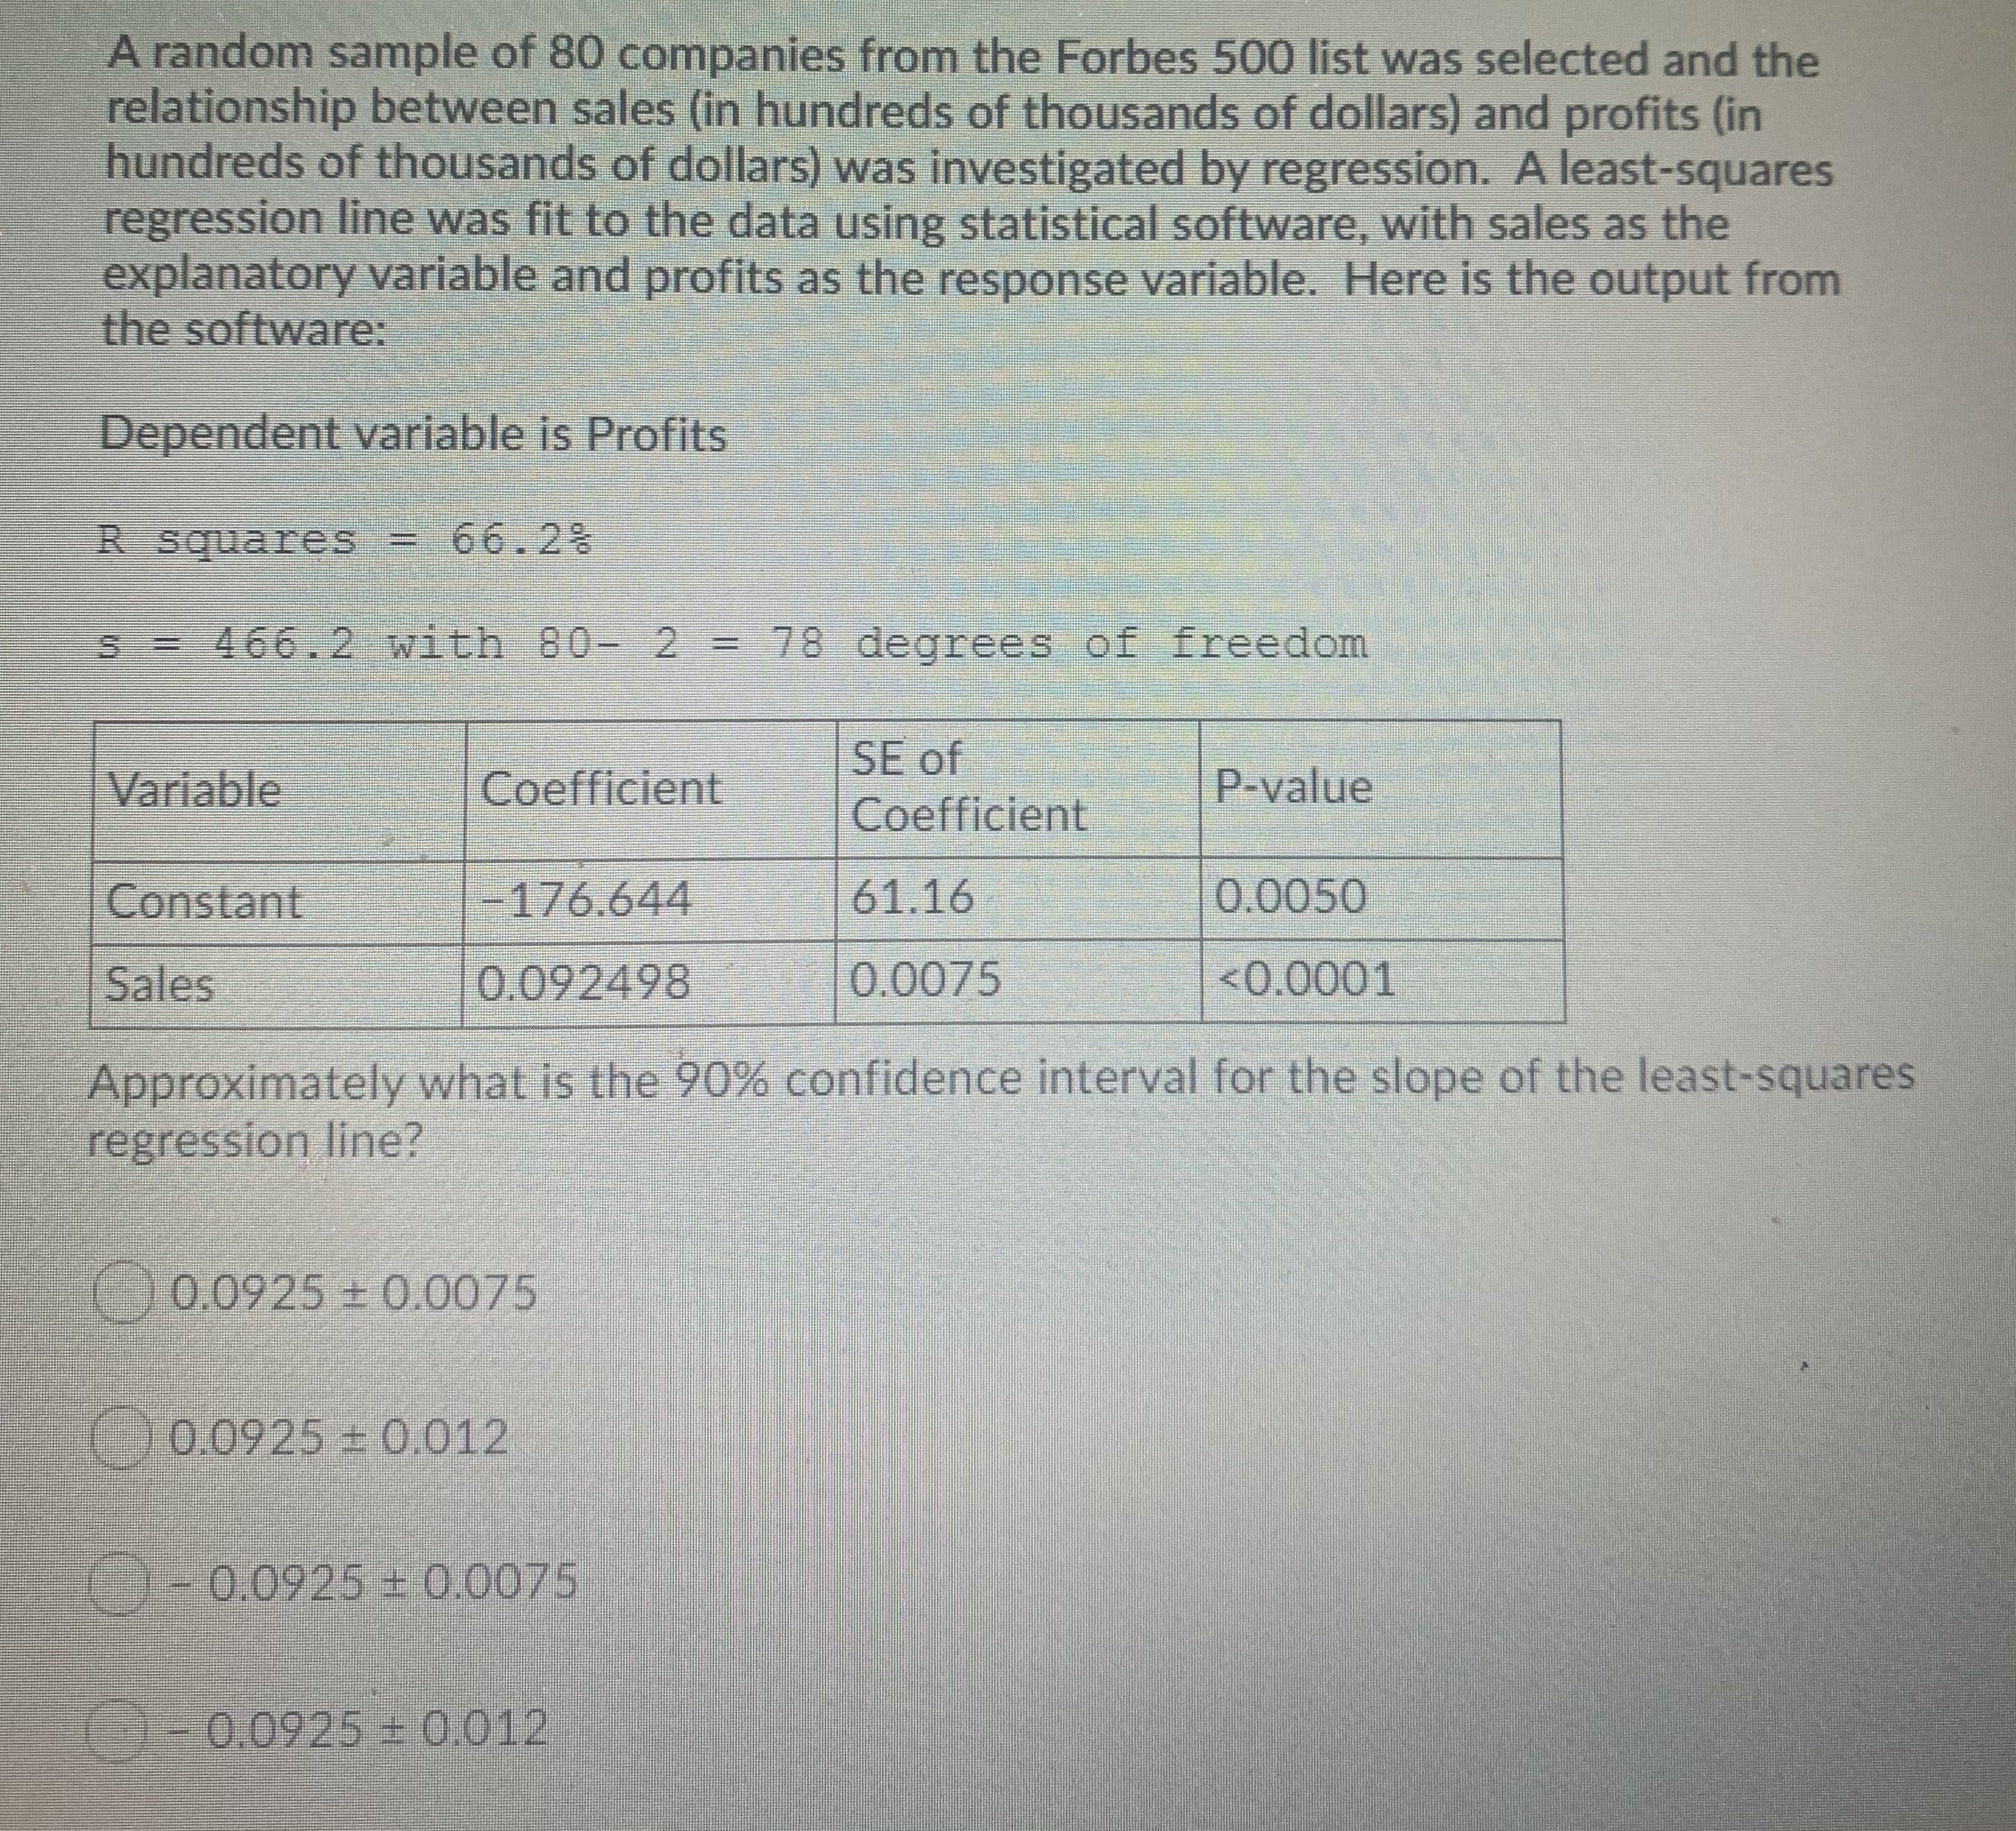
Inference for regression on the population regression slope B is based on which of the following distributions? The t distribution with n 1 - degrees of freedom The standard normal distribution The chi-square distribution with n - 1 degrees of freedom The ( distribution with n - 2 degrees of freedomIn inference for regression, the statistic s represents )The estimate of the standard deviation s in the regression model The standard deviation of the x-values in the paired observations (x. v) The estimate of the y-intercept The standard deviation of the y-values in the paired observations (x. >)A random sample of 80 companies from the Forbes 500 list was selected and the relationship between sales (in hundreds of thousands of dollars) and profits (in hundreds of thousands of dollars) was investigated by regression. A least-squares regression line was fit to the data using statistical software, with sales as the explanatory variable and profits as the response variable. Here is the output from the software: Dependent variable is Profits quares 66.28 6.2 with 80- 2 = 78 degrees of freedom SE of Variable Coefficient Coefficient P-value Constant 176.644 61.16 0.0050 Sales 0.092498 0.0075 0, where B is the population regression slope, then the least-squares regression line O Slopes downward and to the right when plotted on the scatterplot of paired observations (x, y) Is useful for predicting y given x (within the limits of x-values covered by the data) Can be extrapolated beyond the limits of the x-values covered by the data to predict y at any possible x Is not useful for predicting y given xA random sample of 80 companies from the Forbes 500 list was selected and the relationship between sales (in hundreds of thousands of dollars) and profits (in hundreds of thousands of dollars) was investigated by regression. A least-squares regression line was fit to the data using statistical software, with sales as the explanatory variable and profits as the response variable. Here is the output from the software: Dependent variable is Profits squares = 66.2: = 466.2 with 80- 2 = 78 degrees of freedom SE of Variable Coefficient Coefficient P-Value Constant 176.644 61.16 0.0050 Sales 0.09498 0.0075
Step by Step Solution
There are 3 Steps involved in it

Get step-by-step solutions from verified subject matter experts