

Question: AP statistics help Directions: Always show work on every problem. Remember to complete the submission information on every page you turn in. Free Response: 2
AP statistics help
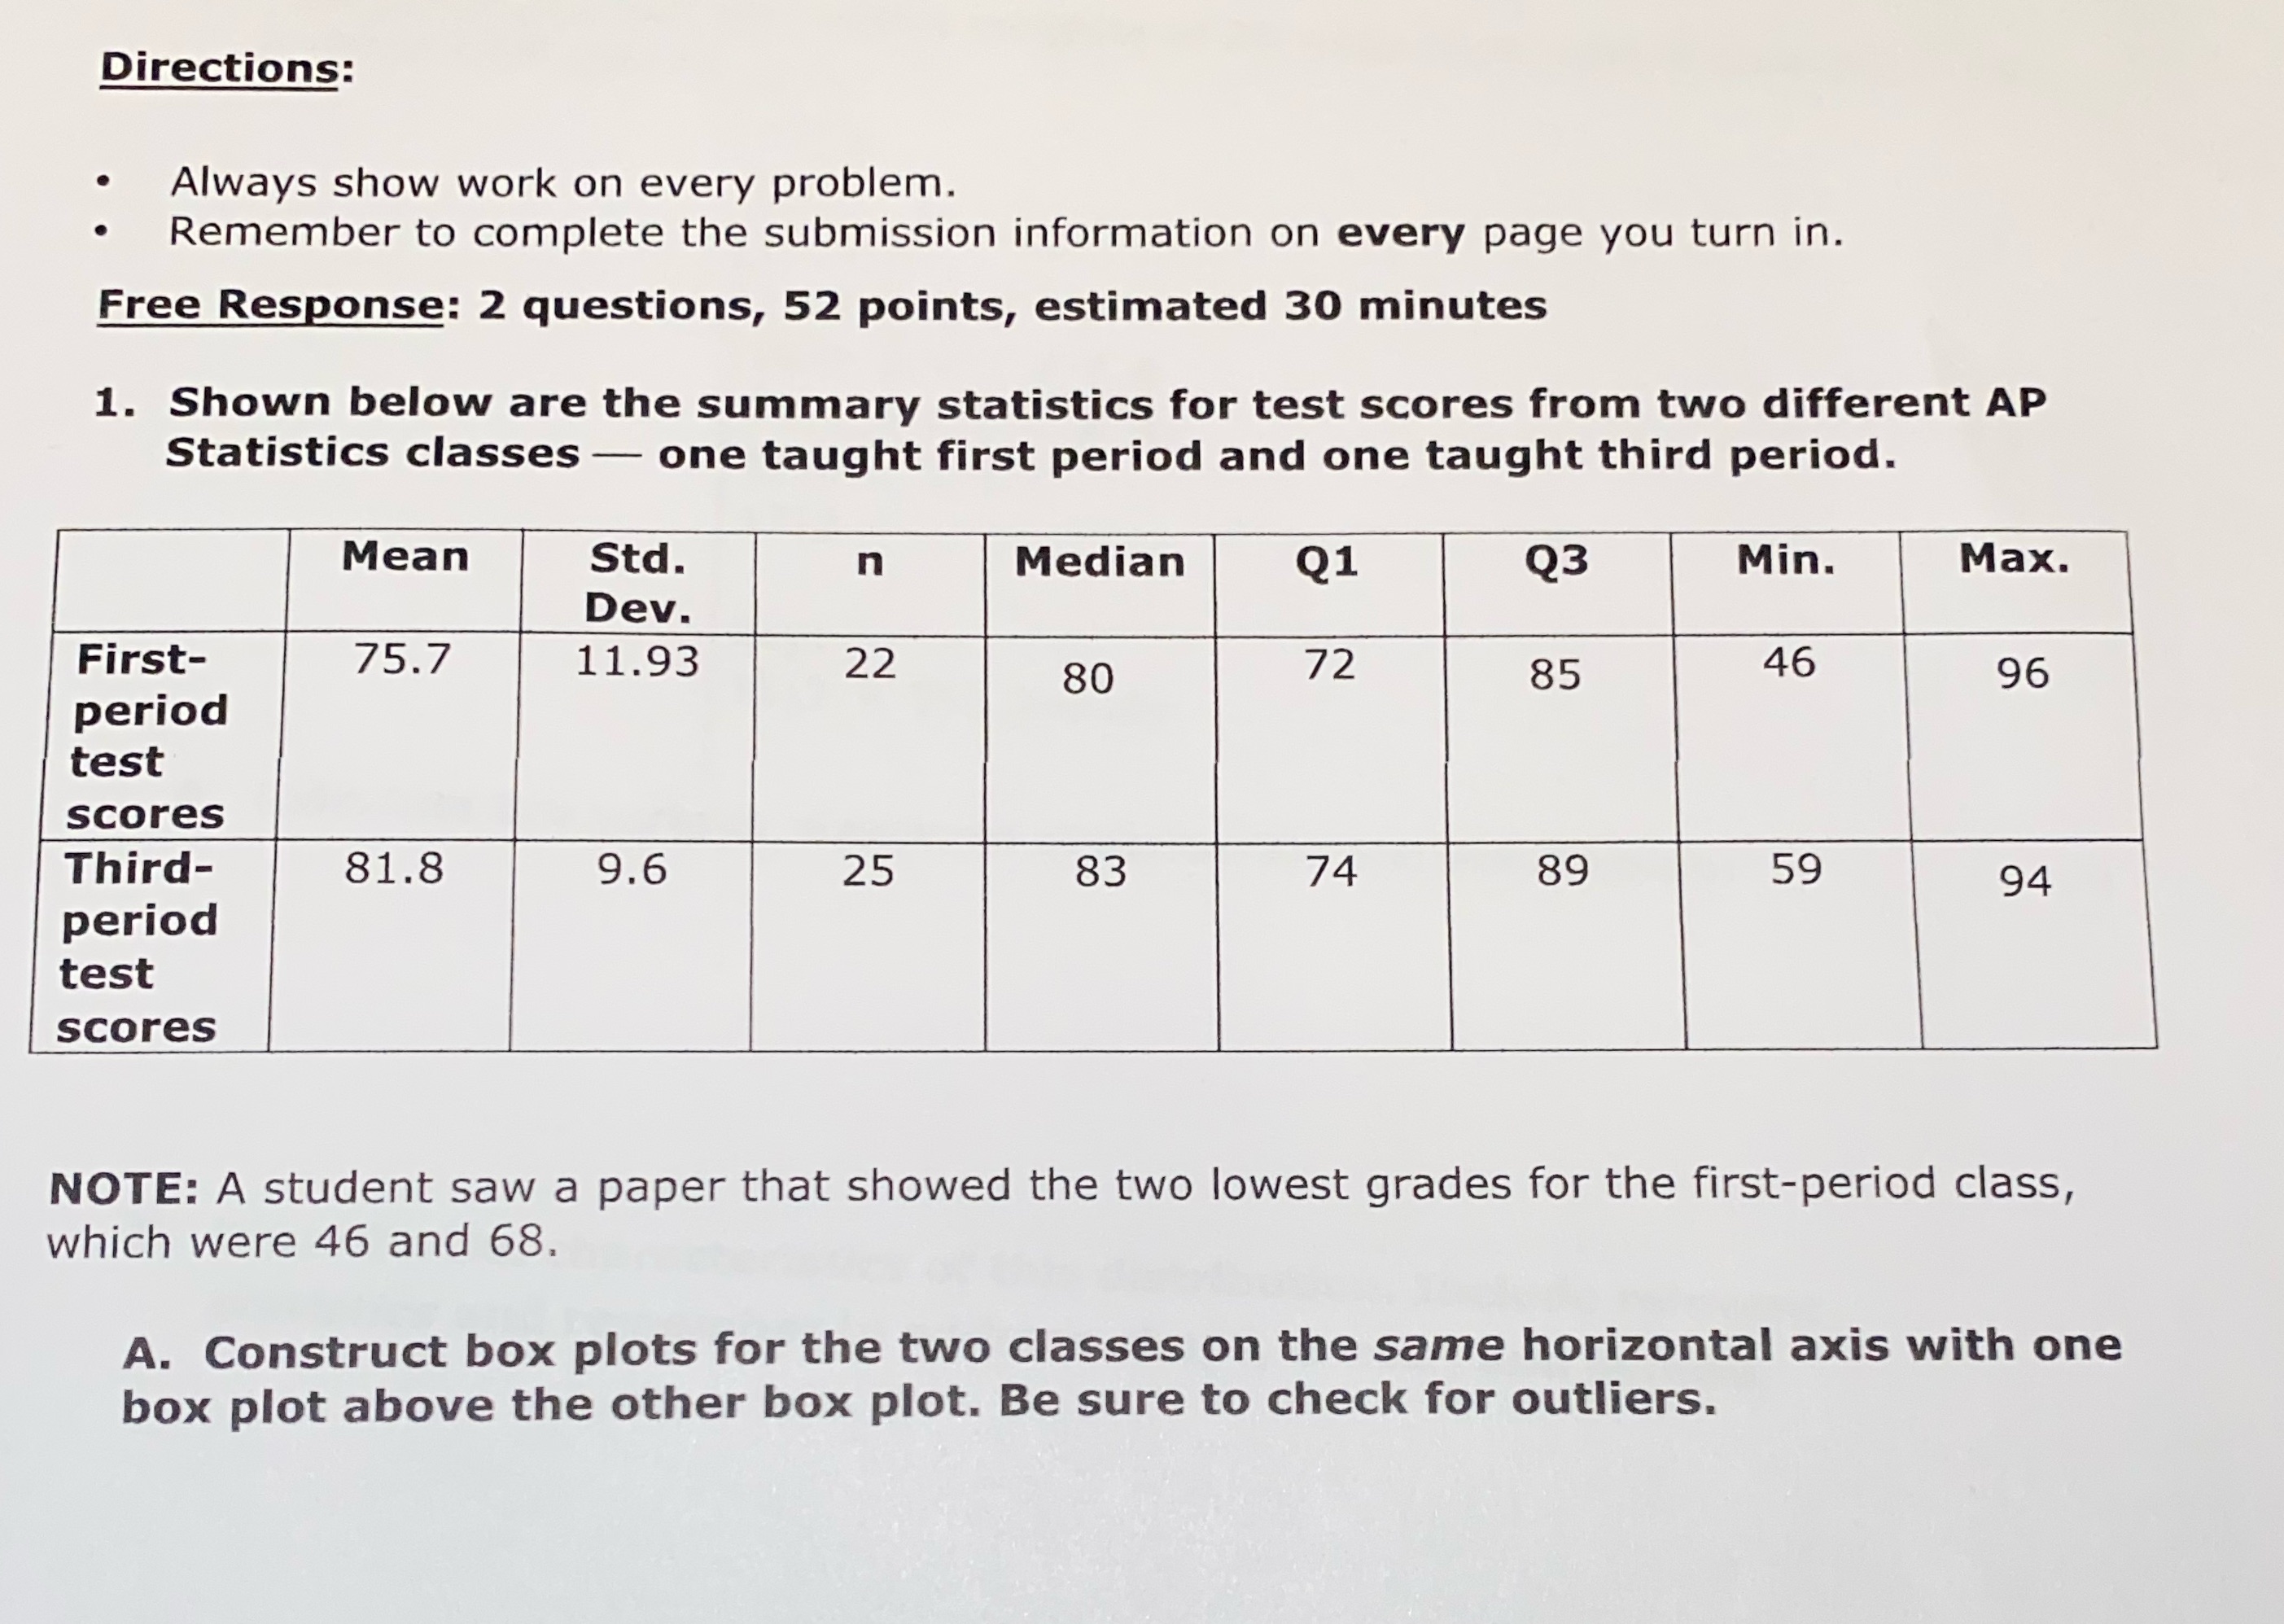
Directions: Always show work on every problem. Remember to complete the submission information on every page you turn in. Free Response: 2 questions, 52 points, estimated 30 minutes 1. Shown below are the summary statistics for test scores from two different AP Statistics classes - one taught first period and one taught third period. Mean Std. n Median Q1 Q3 Min. Max. Dev. First- 75.7 11.93 22 80 72 85 46 96 period test scores Third- 81.8 9.6 25 33 74 89 59 94 period test scores NOTE: A student saw a paper that showed the two lowest grades for the first-period class, which were 46 and 68. A. Construct box plots for the two classes on the same horizontal axis with one box plot above the other box plot. Be sure to check for outliers
Step by Step Solution
There are 3 Steps involved in it

Get step-by-step solutions from verified subject matter experts