

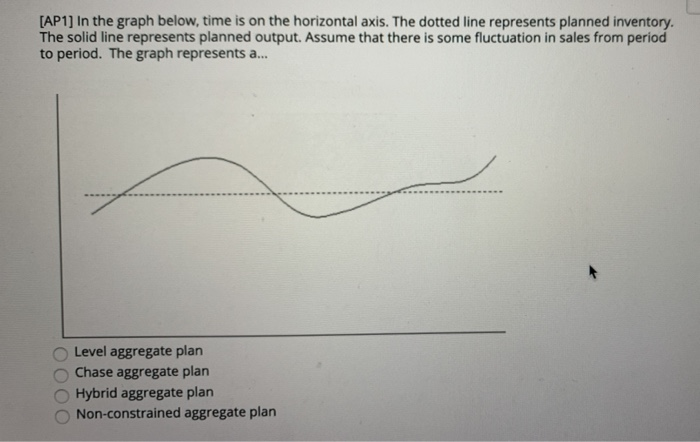
Question: [AP1) In the graph below, time is on the horizontal axis. The dotted line represents planned inventory. The solid line represents planned output. Assume that
Step by Step Solution
There are 3 Steps involved in it
1 Expert Approved Answer
Step: 1 Unlock

Question Has Been Solved by an Expert!
Get step-by-step solutions from verified subject matter experts
Step: 2 Unlock
Step: 3 Unlock