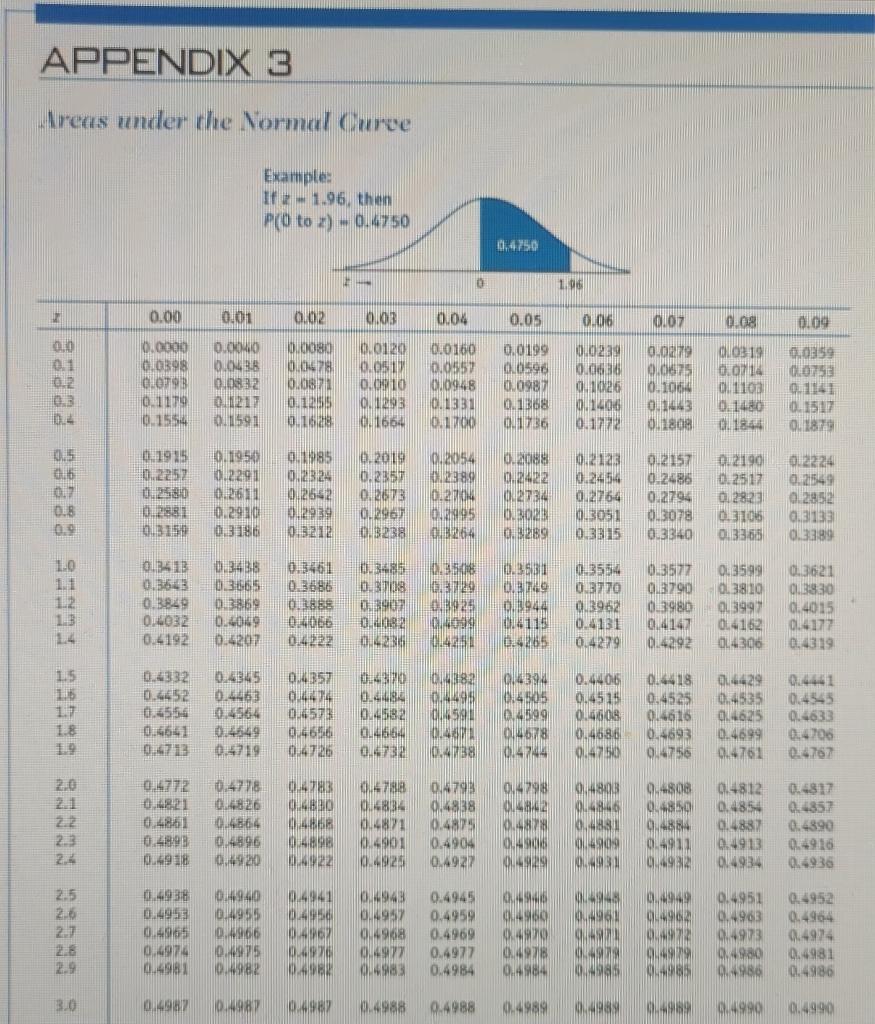
Question: APPENDIX 3 Areas under the Normal Curve Example: If - 1.96, then P(O to x) - 0.4750 0.4750 0 10 0.00 0.01 2010 0.03 0.04

APPENDIX 3 Areas under the Normal Curve Example:APPENDIX 3 Areas under the Normal Curve Example:

APPENDIX 3 Areas under the Normal Curve Example: If - 1.96, then P(O to x) - 0.4750 0.4750 0 10 0.00 0.01 2010 0.03 0.04 0.05 0.06 0.07 0.08 0109 0.0000 0.0120 0.05 0.0359 8600 00 01 02 0.3 CLOE19 0.714 0.0100 0,0957 0.0948 0.000 0.0498 0.0832 011211 1591 ESOTO 0.000 0.0478 0.087 0.12.55 0.1528 QUOT98 0.117 0.1554 OD 600 0.0199 0.0590 0.0987 0.1258 0.0239 0.0836 0.108216 0.1400 10.1772 0.0279 0.067 0.1004 0.1443 Ou1808 BOTTO TEETTO 0.1293 0.1664 70 0.114 0.1517 1879 0.1480 0.1844 0.1700 982 0.5 0.6 LSIZIO 0.1915 10.2252 0.2580 03581 3159 410 0.1950 10.2291 0.261 0.2930 0.3186 085 0.2324 0.2542 02039 0.3212 0.2019 0.2357 0.2673 0.296 D5238 02054 2389 0.2014 0.2018 0.242 0273 CUBO 0.5289 0.2123 0.2454 0.2764 03051 0.3215 2190 0.2517 012823 0.3106 013355 012224 0.21549 02852 013133 0.3389 0.2485 0.2794 003078 0.3340 028 09 Soon 0.3264 1.0 0.3451 0.3508 O13413 0.3543 0.3849 98980 0134438 0.3655 0.38.50 0.0049 0.4207 D34 0708 0902 0.3599 0.3810 0.5925 0.31 DAS 0.1944 4115 0.4265 (13554 0.3770 0.3962 0.4131 0.4279 0.3577 0.3790 013980 0.4147 0.4292 0.3888 0.4066 0.4232 266E 10 013621 3830 0.4015 0.4177 0.4319 1.3 ZEOMO 20 0.4192 0423 0.425 04162 0L4306 15 115 1.17 1.8 0.4332 0.4452 0.4554 0.6541 0.6713 0.4345 04463 0.4564 182 449 0.4857 0.444 0.6572 0.4656 0.4725 0.450 0.4486 0.4592 0.4664 0.4732 394 0.4505 04599 TBS 0.4406 0.4515 044608 0.4686 044760 OK18 0.4525 OL4616 0.4693 04756 0429 04535 10,4625 0.4699 0.4761 04441 10.4545 0.4633 0.4706 0.4767 829010 0.48 0.4738 0.419 0424 0.4772 0.4821 04783 0.4798 4.42 1980 22 23 24 0.4718 0.48 20 0.4864 0.4896 0.4920 DO O RO 0.788 4834 0.4871 0.4901 0.4925 0.4793 04838 0.4875 0.4904 0.4927 04803 0484 0,468 4909 D. 0.4808 04850 9.4884 0.4913 04932 0,4812 0.485 0.4887 0.4913 044934 0.4817 0.4857 0.4890 0.4916 0.4936 906 0.4893 0.6918 22 929 2.5 04946 06 0.4938 0.4953 0.4965 0.4974 0.4981 27 28 0.4940 0.4955 0.4966 0.4975 0982 0.4941 04956 DA62 0.92 DAR 0.4943 0.4957 0.4968 0.4977 0.4945 0.4959 0.4969 0.4977 0.4984 0948 LAN OS CAS20 0.4978 0.AS 0449 04910 2 4979 85 0.4951 0.4983 044973 0.4980 0952 0.4964 0.4974 0.4981 0.4986 WE SIS ERO 986 3.0 0,4987 0.4987 0.4988 0.4988 0.4989 696 9.4990 0.4990 Question 4. (6 points): A company is trying to determine an appropriate inventory policy and has gathered the following information. It has annual demand for 18,000 units. The holding cost is $1.5 per unit each year, the cost of placing one order is $240. Please use the EOQ model to evaluate inventory policy and suggest any improvements. a. (1 point) What is the optimal order size? b. (0.5 point) What is the optimal number of orders per year? c.(0.5 point) What is the optimal inventory cycle length (given 260 workdays per year)? d. (1 point) Determine is the optimal total annual ordering cost? e (1 point) The present company policy is to place an order every 4 months. What are the costs of this policy? Is there an improvement if we change to optimal order size? f ( point, What happens to the optimal quantity and the inventory-related cost if the unit holding cost were to increase? g (0.5 point) If there is a lead time of 26 days (given 260 workdays per year), what is the optimal seordes point? h. (0.5 point) If lead time doubles what is the optimal reorder point

Step by Step Solution

There are 3 Steps involved in it

1 Expert Approved Answer
Step: 1 Unlock blur-text-image
Question Has Been Solved by an Expert!

Get step-by-step solutions from verified subject matter experts

Step: 2 Unlock
Step: 3 Unlock

Students Have Also Explored These Related General Management Questions!