

Question: question 11 can i have help with this question 11. Can i have help with this problem OPS 1100 = Test: E-Test3 Demand = 100,000
question 11 can i have help with this question 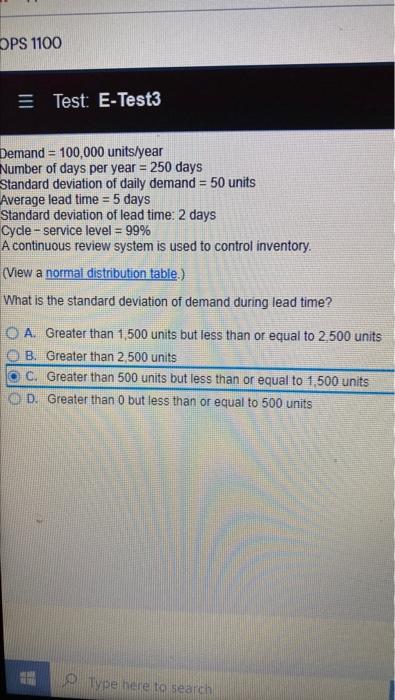
11. Can i have help with this problem
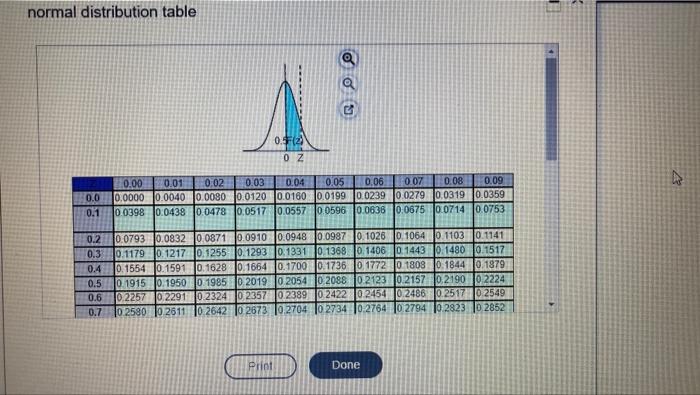
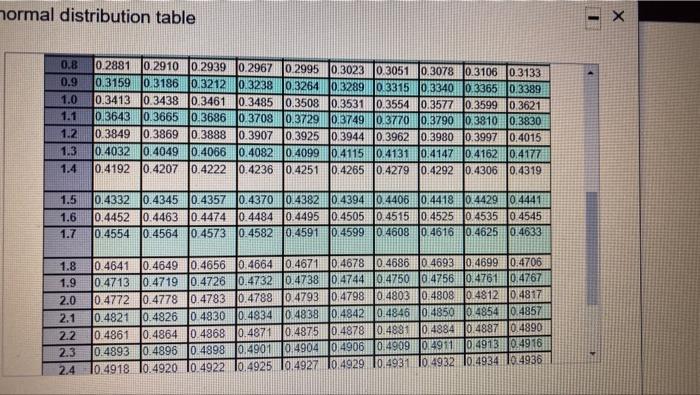
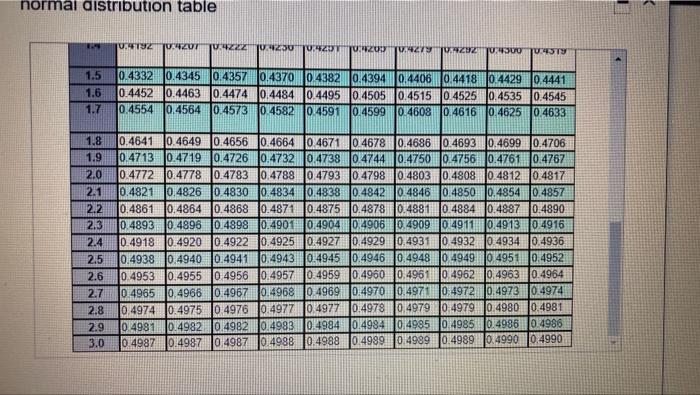
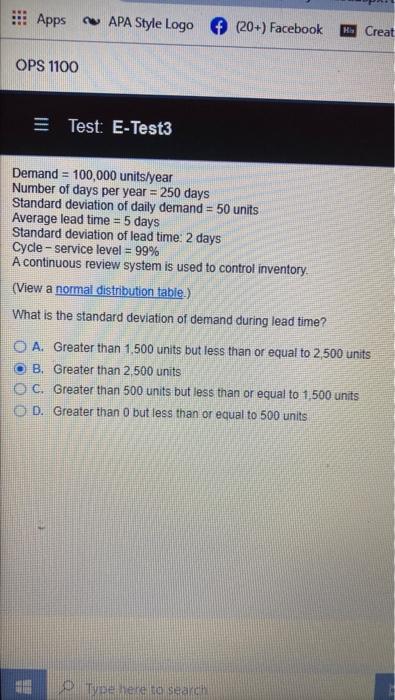
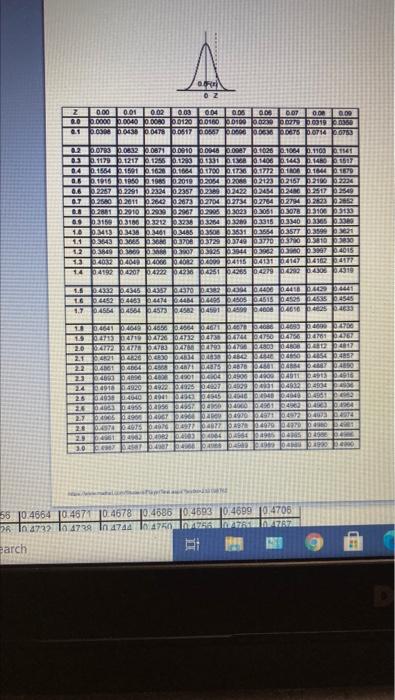
OPS 1100 = Test: E-Test3 Demand = 100,000 units/year Number of days per year = 250 days Standard deviation of daily demand = 50 units Average lead time = 5 days Standard deviation of lead time: 2 days Cycle-service level = 99% A continuous review system is used to control inventory. (View a normal distribution table.) What is the standard deviation of demand during lead time? O A. Greater than 1,500 units but less than or equal to 2.500 units B. Greater than 2,500 units C. Greater than 500 units but less than or equal to 1,500 units D. Greater than 0 but less than or equal to 500 units o Type here to search normal distribution table Q Q 0.5 (2) 0Z 0.0 0.00 0.01 0.02 0.03 0.04 0.05 0.06 0.07 0.08 0.09 0.0000 0.0040 0.0080 0.0120 0.0160 0.0199 0.0239 0.0279 0.0319 0.0359 0.0398 0.0438 0.0478 10.0517 10.0557 10.0596 0.0636 0.0675 0.0714 0.0753 0.1 PI 0.2 0.3 0.4 0.5 0.6 0.7 0.0793 10.0832 10.0871 10.0910 0.0948 0.0987 0.1026 0,1064 0.1103 10.1141 10.1179 10. 1217 10.1255 10.1293 0.1331 0.1368 10. 1406 01443 10 1480 10.1517 0.1554 0.1591 0.1628 0.1664 0.1700 0.1736 10. 1772 0 1809 0.1844 0.1879 0 1915 0.19500 1985 0 2019 10 20540 2088 0.2123 02157 0.2190 0.2224 0.2257 0.2291 0.232402357 02389 0 2422 0.2454 0.2486 0.25170.2549 10 2580 10 2611 0.26420 2673 102704 102734 10.2764 10.2794 0.2823 10 2852 Print Done normal distribution table 0.8 0.9 1.0 1.1 1.2 1.3 1.4 0.2881 0.2910 10.2939 10.2967 10.2995 10.3023 0.3051 10.3078 10.3106 10.3133 0.31590.3186 0.3212 10.3238 6.3264 0.3289 03315 0.3340 0.3365 0.3389 0.3413 0.3438 0.3461 0.3485 0.3508 0.3531 0.3554 0.3577 10.3599 0.3621 0.3643 0.3665 0.3686 0 370 0.37290.37490.3770 0.3790 0.3810 0.3830 0.3849 0.3869 0.3888 10.3907 0.3925 0.3944 0.3962 10.3980 0.3997 0.4015 0.4032 0.4049 10.4066 0.4082 0.4099 0.4115 0.4131 0.4147 0.4162 10.4177 0.4192 10.4207 0.4222 0.4236 0.4251 0.4265 10.4279 0.4292 0.4306 0.4319 1.5 1.6 1.7 0.4332 10.4345 10.4357 0.4370 1024382 10.4394 10.4406 10.4418 10.4429 10.4441 0.4452 0.4463 0.4474 0.4484 0.4495 0.4505 0.4515 0.4525 0 4535 0.4545 0.4554 10.4564 10 4573 10.4582 10.4591 10.4599 0.4608 10.4616 10.4625 10.4633 1.8 1.9 2.0 2.1 2.2 2.3 2.4 NIMININNIE 10.4641 0.4649 10.4656 10.4664 10.4671 10.4678 0.4686 10.4693 0.4699 0.4706 0.4713 0.4719 0.4726 0.4732 0.4738 0.474404750 034756 0.476104767 0.4772 10.4778 10.4783 10.4789 JO 4793 0.4798 0.4803 0.4808 0 4812 10.4817 0.4821 0.4826 0 4830 10.4834 0 4838 0.4842 0.48460.4850 0 4854 0.4857 0.4861 10.4864 0.4868 10.4871 10.4875 0.4878 0.48810 4884 0.488710.4890 0.4893 094896 0.48980/490101490410149060149090191104913 0.4976 10.4918 10.4920 10.492210.4925 10.4927 0.4929 10.093104932 10,49341014936 1 C normai distribution table 10.9192 T. ZUT ZEZ 200 WOWZTV.AZ/ AZIZA. 0.43TY 1.5 1.6 1.7 10.4332 0.4345 0.4357 0.4370 0.4382 0.4394 0.4406 0.4418 0 4429 0.4441 0.4452 0.4463 0.4474 10.4484 0.4495 10.4505 10.4515 0.4525 0.4535 10.4545 0.4554 10.4564 10.4573 10.4582 10.4591 10.4599 10.4608 0.4616 10.4625 10.4633 1.8 1.9 2.0 2.1 2.2 2.3 2.4 2.5 2.6 2.7 0.4641 10.4649 10.4656 10.4664 0.4671 0.4678 0.4686 10.4693 10.4699 0.4706 10:4713 0.4719 10.4726 10.4732 0.4738 0,4744 0.4750 10.4756 10.4761 10.4767 0.4772 0.4778 0.4783 0.4788 0.4793 0 4798 0.4803 10.4808 10 4812 10.4817 0.4821 0.4826 0.4830 0.4834 10.4838 10.4842 0.4846 0.4850 10.4854 10.4857 0.4861 0.4864 0.4868 0.4871 10.4875 10.4878 0.4881 0 4884 0.4887 0.4890 0.4893 0.4896 0.4898 0.4901 0.4904014906 0 4909 0:49110,4913 0 4916 0.4918 10.4920 10.4922 10.4925 10.4927 0.4929 10.4931 10 4932 10 4934 0.4936 0.4938 10.4940 10.4941 10.4943 0.4945 0.4946 0.4948 0 4949 0.4951 0.4952 0.4953 0.4955 0.4956 0.4957 10.4959 0.4960 0,4967 0.4962 0.49630.4964 0 4965 0.4966 0.4967 0.496804969|| 0.4970 0.4970.49720.4973 0.4974 0.4974 10.4975 10.4976 10.4977 10.49770.4978 10.4979 10.4979 10.4980 10.4981 0.49810.49820.49820.49830,4984 0.4984|0:49850.4985.0.4986.0.4986 0.4987 0.4987 10.4987 10.4988 10.4988 10.4999 0.4989 10.4989.10.4990 10.4990 NINININ O CONGO 2.8 ! 2.9 3.0 Apps APA Style Logo (20+) Facebook His Creat OPS 1100 = Test: E-Test3 Demand = 100,000 units/year Number of days per year = 250 days Standard deviation of daily demand = 50 units Average lead time = 5 days Standard deviation of lead time: 2 days Cycle-service level = 99% A continuous review system is used to control inventory (View a normal distribution table.) What is the standard deviation of demand during lead time? O A. Greater than 1,500 units but less than or equal to 2,500 units O B. Greater than 2.500 units OC. Greater than 500 units but less than or equal to 1.500 units OD. Greater than 0 but less than or equal to 500 units 0 Type here to search Valo . 0Z Z 000 002 0.01 0.00 004 0.08 0.08 D.OT 0.00 0.00 0.0000 .000 .000 .0120.0160.0100 ST pre p0919 26350 po poco 0478 0917 Pos67088066 P16075 074 073 20 03 score 0.2 03 04 26 0.6 0.7 TOTRO 2.0832 0.0871000100046 pote7010261064 p.11002 Tet 1179 212171256012831312120-1406 101617 01564 21501 21001 1700 1736 1772 10 1644 BETTO 1916 1950 1985 2019 2064 20100212327167 7100226 02287 22281 2202357 238092422 04542480 2517 349 2560 2011 02642 2073 274 275 2764 2794 .223 262 0.2881 2010 2009 2007 2008 3023 3051 3078 3100 3130 03150 3100 2.3212 2.3238 3260 300 3015 23340 3306 3380 p.413 23438 3481 0.3485 350 3631 0.3554 0.357 0.3590321 23643 3688 1368 37063529 5770 5610 3830 033925 346 325 377015 402 400/400070211521312187 174102 974792 0.4207747227236 60 1.0 1.1 99 1.3 10 LORZEZDY 7519 OLETEI 1.5 2,4332 2,4345 4337 2.32004400 A 16 405240341344 3450541945574535 5.7 456 4584 245 2452 450 450 4600 4650 425 0.4545 18 19 2.0 2.1 HOTC 0.4641 046460 467 267 400 04/15 0471204732 473 47904766 267 278 476 277900004860 42 O4042 SEP 48S? Day 2075 200 SX 040 A 943010198099201116 4504 ORD 23 14 2.5 26 21 20 CODE REASON LOC LEDERGRONDE DE GESOME BOTE 203 95226565 400O490124902 0096 04067070995742403 2012072947774970 pro 900 20822103004542900 95 AR 9 ES SRETOS 3.0 55 10.4564 10.467 0.4678 10.4686 10.4693 0.4609014706 of earch Ei OPS 1100 = Test: E-Test3 Demand = 100,000 units/year Number of days per year = 250 days Standard deviation of daily demand = 50 units Average lead time = 5 days Standard deviation of lead time: 2 days Cycle-service level = 99% A continuous review system is used to control inventory. (View a normal distribution table.) What is the standard deviation of demand during lead time? O A. Greater than 1,500 units but less than or equal to 2.500 units B. Greater than 2,500 units C. Greater than 500 units but less than or equal to 1,500 units D. Greater than 0 but less than or equal to 500 units o Type here to search normal distribution table Q Q 0.5 (2) 0Z 0.0 0.00 0.01 0.02 0.03 0.04 0.05 0.06 0.07 0.08 0.09 0.0000 0.0040 0.0080 0.0120 0.0160 0.0199 0.0239 0.0279 0.0319 0.0359 0.0398 0.0438 0.0478 10.0517 10.0557 10.0596 0.0636 0.0675 0.0714 0.0753 0.1 PI 0.2 0.3 0.4 0.5 0.6 0.7 0.0793 10.0832 10.0871 10.0910 0.0948 0.0987 0.1026 0,1064 0.1103 10.1141 10.1179 10. 1217 10.1255 10.1293 0.1331 0.1368 10. 1406 01443 10 1480 10.1517 0.1554 0.1591 0.1628 0.1664 0.1700 0.1736 10. 1772 0 1809 0.1844 0.1879 0 1915 0.19500 1985 0 2019 10 20540 2088 0.2123 02157 0.2190 0.2224 0.2257 0.2291 0.232402357 02389 0 2422 0.2454 0.2486 0.25170.2549 10 2580 10 2611 0.26420 2673 102704 102734 10.2764 10.2794 0.2823 10 2852 Print Done normal distribution table 0.8 0.9 1.0 1.1 1.2 1.3 1.4 0.2881 0.2910 10.2939 10.2967 10.2995 10.3023 0.3051 10.3078 10.3106 10.3133 0.31590.3186 0.3212 10.3238 6.3264 0.3289 03315 0.3340 0.3365 0.3389 0.3413 0.3438 0.3461 0.3485 0.3508 0.3531 0.3554 0.3577 10.3599 0.3621 0.3643 0.3665 0.3686 0 370 0.37290.37490.3770 0.3790 0.3810 0.3830 0.3849 0.3869 0.3888 10.3907 0.3925 0.3944 0.3962 10.3980 0.3997 0.4015 0.4032 0.4049 10.4066 0.4082 0.4099 0.4115 0.4131 0.4147 0.4162 10.4177 0.4192 10.4207 0.4222 0.4236 0.4251 0.4265 10.4279 0.4292 0.4306 0.4319 1.5 1.6 1.7 0.4332 10.4345 10.4357 0.4370 1024382 10.4394 10.4406 10.4418 10.4429 10.4441 0.4452 0.4463 0.4474 0.4484 0.4495 0.4505 0.4515 0.4525 0 4535 0.4545 0.4554 10.4564 10 4573 10.4582 10.4591 10.4599 0.4608 10.4616 10.4625 10.4633 1.8 1.9 2.0 2.1 2.2 2.3 2.4 NIMININNIE 10.4641 0.4649 10.4656 10.4664 10.4671 10.4678 0.4686 10.4693 0.4699 0.4706 0.4713 0.4719 0.4726 0.4732 0.4738 0.474404750 034756 0.476104767 0.4772 10.4778 10.4783 10.4789 JO 4793 0.4798 0.4803 0.4808 0 4812 10.4817 0.4821 0.4826 0 4830 10.4834 0 4838 0.4842 0.48460.4850 0 4854 0.4857 0.4861 10.4864 0.4868 10.4871 10.4875 0.4878 0.48810 4884 0.488710.4890 0.4893 094896 0.48980/490101490410149060149090191104913 0.4976 10.4918 10.4920 10.492210.4925 10.4927 0.4929 10.093104932 10,49341014936 1 C normai distribution table 10.9192 T. ZUT ZEZ 200 WOWZTV.AZ/ AZIZA. 0.43TY 1.5 1.6 1.7 10.4332 0.4345 0.4357 0.4370 0.4382 0.4394 0.4406 0.4418 0 4429 0.4441 0.4452 0.4463 0.4474 10.4484 0.4495 10.4505 10.4515 0.4525 0.4535 10.4545 0.4554 10.4564 10.4573 10.4582 10.4591 10.4599 10.4608 0.4616 10.4625 10.4633 1.8 1.9 2.0 2.1 2.2 2.3 2.4 2.5 2.6 2.7 0.4641 10.4649 10.4656 10.4664 0.4671 0.4678 0.4686 10.4693 10.4699 0.4706 10:4713 0.4719 10.4726 10.4732 0.4738 0,4744 0.4750 10.4756 10.4761 10.4767 0.4772 0.4778 0.4783 0.4788 0.4793 0 4798 0.4803 10.4808 10 4812 10.4817 0.4821 0.4826 0.4830 0.4834 10.4838 10.4842 0.4846 0.4850 10.4854 10.4857 0.4861 0.4864 0.4868 0.4871 10.4875 10.4878 0.4881 0 4884 0.4887 0.4890 0.4893 0.4896 0.4898 0.4901 0.4904014906 0 4909 0:49110,4913 0 4916 0.4918 10.4920 10.4922 10.4925 10.4927 0.4929 10.4931 10 4932 10 4934 0.4936 0.4938 10.4940 10.4941 10.4943 0.4945 0.4946 0.4948 0 4949 0.4951 0.4952 0.4953 0.4955 0.4956 0.4957 10.4959 0.4960 0,4967 0.4962 0.49630.4964 0 4965 0.4966 0.4967 0.496804969|| 0.4970 0.4970.49720.4973 0.4974 0.4974 10.4975 10.4976 10.4977 10.49770.4978 10.4979 10.4979 10.4980 10.4981 0.49810.49820.49820.49830,4984 0.4984|0:49850.4985.0.4986.0.4986 0.4987 0.4987 10.4987 10.4988 10.4988 10.4999 0.4989 10.4989.10.4990 10.4990 NINININ O CONGO 2.8 ! 2.9 3.0 Apps APA Style Logo (20+) Facebook His Creat OPS 1100 = Test: E-Test3 Demand = 100,000 units/year Number of days per year = 250 days Standard deviation of daily demand = 50 units Average lead time = 5 days Standard deviation of lead time: 2 days Cycle-service level = 99% A continuous review system is used to control inventory (View a normal distribution table.) What is the standard deviation of demand during lead time? O A. Greater than 1,500 units but less than or equal to 2,500 units O B. Greater than 2.500 units OC. Greater than 500 units but less than or equal to 1.500 units OD. Greater than 0 but less than or equal to 500 units 0 Type here to search Valo . 0Z Z 000 002 0.01 0.00 004 0.08 0.08 D.OT 0.00 0.00 0.0000 .000 .000 .0120.0160.0100 ST pre p0919 26350 po poco 0478 0917 Pos67088066 P16075 074 073 20 03 score 0.2 03 04 26 0.6 0.7 TOTRO 2.0832 0.0871000100046 pote7010261064 p.11002 Tet 1179 212171256012831312120-1406 101617 01564 21501 21001 1700 1736 1772 10 1644 BETTO 1916 1950 1985 2019 2064 20100212327167 7100226 02287 22281 2202357 238092422 04542480 2517 349 2560 2011 02642 2073 274 275 2764 2794 .223 262 0.2881 2010 2009 2007 2008 3023 3051 3078 3100 3130 03150 3100 2.3212 2.3238 3260 300 3015 23340 3306 3380 p.413 23438 3481 0.3485 350 3631 0.3554 0.357 0.3590321 23643 3688 1368 37063529 5770 5610 3830 033925 346 325 377015 402 400/400070211521312187 174102 974792 0.4207747227236 60 1.0 1.1 99 1.3 10 LORZEZDY 7519 OLETEI 1.5 2,4332 2,4345 4337 2.32004400 A 16 405240341344 3450541945574535 5.7 456 4584 245 2452 450 450 4600 4650 425 0.4545 18 19 2.0 2.1 HOTC 0.4641 046460 467 267 400 04/15 0471204732 473 47904766 267 278 476 277900004860 42 O4042 SEP 48S? Day 2075 200 SX 040 A 943010198099201116 4504 ORD 23 14 2.5 26 21 20 CODE REASON LOC LEDERGRONDE DE GESOME BOTE 203 95226565 400O490124902 0096 04067070995742403 2012072947774970 pro 900 20822103004542900 95 AR 9 ES SRETOS 3.0 55 10.4564 10.467 0.4678 10.4686 10.4693 0.4609014706 of earch Ei
Step by Step Solution
There are 3 Steps involved in it
1 Expert Approved Answer
Step: 1 Unlock

Question Has Been Solved by an Expert!
Get step-by-step solutions from verified subject matter experts
Step: 2 Unlock
Step: 3 Unlock