

Question: Appendix 5.A Answer A-E in R code 13. The data in Appendix 5.A (see Lai and Xing (2008), p. 71) denote log- returns on six
Appendix 5.A
Answer A-E in R code
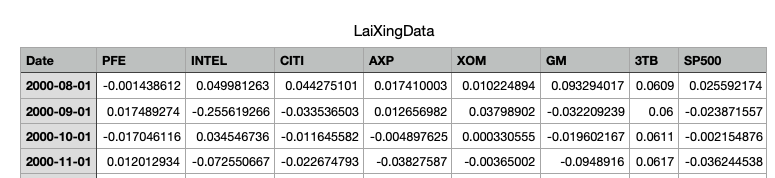
13. The data in Appendix 5.A (see Lai and Xing (2008), p. 71) denote log- returns on six stocks, monthly observations from August 2000 to October 2005, where PFE=Pfizer, INTEL=Intel, CITI=Citigroup, AXP=American Express, XOM= Exxon-Mobil, GM=General Motors. In addition, the data include log-returns for 3TB=3-month treasury bill rate and the SP500. (a) Graph the t-plots for all the log-returns series and evaluate the presence of any chance regularity patterns associated with heterogeneity. (b) Use a second-order polynomial (1,14), for t = 1,2, ..., n, to detrend the data series that exhibit any mean heterogeneity and use the t-plots of the detrended data to evaluate the presence of any chance regularity patterns associated with dependence. (c) Use two lags (x-1,X1-2) to dememorize all the detrended data series and use the t-plot of the detrended and dememorized data to evaluate the presence of any departures from the Normality assumption. (d) For the detrended and dememorized data: (1) plot their histograms, as well as (ii) their P-P plots, to evaluate your assessment in (c). (e) In light of your answers in (a)-(d), speculate on the possible departures from assuming that a NIID vector process {X,, tN} underlies the above data. 13. The data in Appendix 5.A (see Lai and Xing (2008), p. 71) denote log- returns on six stocks, monthly observations from August 2000 to October 2005, where PFE=Pfizer, INTEL=Intel, CITI=Citigroup, AXP=American Express, XOM= Exxon-Mobil, GM=General Motors. In addition, the data include log-returns for 3TB=3-month treasury bill rate and the SP500. (a) Graph the t-plots for all the log-returns series and evaluate the presence of any chance regularity patterns associated with heterogeneity. (b) Use a second-order polynomial (1,14), for t = 1,2, ..., n, to detrend the data series that exhibit any mean heterogeneity and use the t-plots of the detrended data to evaluate the presence of any chance regularity patterns associated with dependence. (c) Use two lags (x-1,X1-2) to dememorize all the detrended data series and use the t-plot of the detrended and dememorized data to evaluate the presence of any departures from the Normality assumption. (d) For the detrended and dememorized data: (1) plot their histograms, as well as (ii) their P-P plots, to evaluate your assessment in (c). (e) In light of your answers in (a)-(d), speculate on the possible departures from assuming that a NIID vector process {X,, tN} underlies the above data
Step by Step Solution
There are 3 Steps involved in it

Get step-by-step solutions from verified subject matter experts