

Question: Appendix A presents abridged life tables for persons for the United States of America (USA) for the years 2017 and 2020. Using the data in
Appendix A presents abridged life tables for persons for the United States of America (USA) for the years 2017 and 2020. Using the data in Appendix A, write down a formula for and calculate for each life table:
(a) The number (out of l0= 100,000 live births) of survivors to age 5, giving your answers to the nearest whole number.
(b) Life expectancy at birth, giving your answers to two decimal places.
(c) The proportion of births that survive to (exact) age 85, giving your answers to five decimal places.
(d) The proportion of those (exact) age 15 that survive to (exact) age 35, giving your answers to five decimal places.
(e) The probability a 65 year old (exact age) dies before reaching age 85, giving your answers to five decimal places.
(f) The probability a 25 year old (exact age) dies within the next twenty years, giving your answers to five decimal places.
(g) The life table crude birth rate, giving your answers on a per 1000 (life table) population basis and to two decimal places.
(h) The proportion of those aged 15-24 years old (last birthday) who survive to age 25- 34 (last birthday), giving your answers to five decimal places.
(i) The proportion of those aged 75 and above who survive the next ten years, giving your answers to five decimal places.
(j) The proportion of those aged 55-64 last birthday who survive the next twenty years, giving your answers to five decimal places.
(k) Expected age at death of a 25 year old (exact age), giving your answer to two decimal places.
(l) The value of 40q5, giving your answers to five decimal places.
(m) The value of 30L45, giving your answers to the nearest whole number.
(n) The tabulated ages which lie immediately below and immediately above the life table median age at death.
(o) The average number of years lived between birth and exact age 5 by those who die aged under 5, giving your answer to five decimal places.
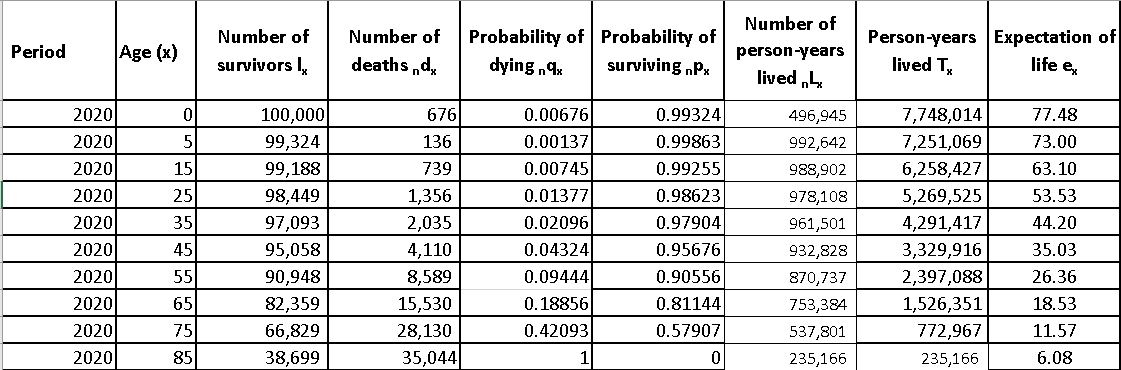
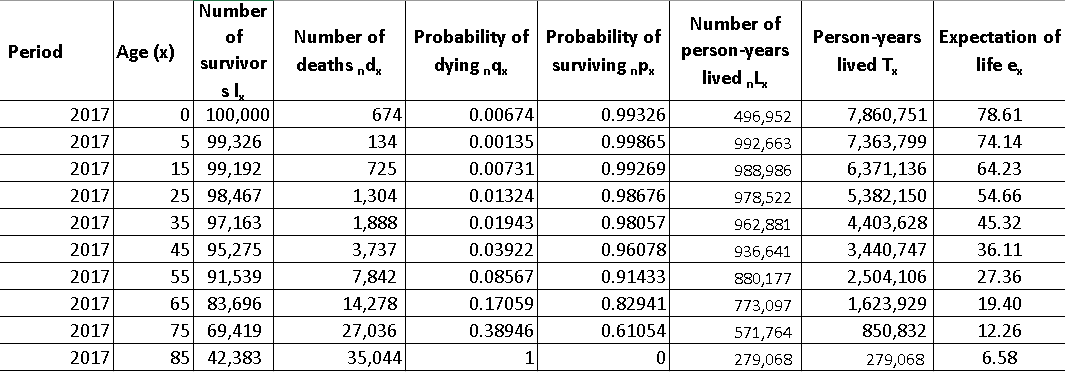
Number of Number of Number of Probability of | Probability of Person-years Expectation of Period Age (x) person-years survivors x deaths , dy dying , 9x surviving nPx lived TX life ex lived , 2020 0 100,000 676 0.00676 0.99324 496,945 7,748,014 77.48 2020 5 99,324 136 0.00137 0.99863 992,642 7,251,069 73.00 2020 15 99,188 739 0.00745 0.99255 988,902 6,258,427 63.10 2020 25 98,449 1,356 0.01377 0.98623 978,108 5,269,525 53.53 2020 35 97,093 2,035 0.02096 0.97904 961,501 4,291,417 44.20 2020 45 95,058 4,110 0.04324 0.95676 932,828 3,329,916 35.03 2020 5.5 90,948 8,589 0.09444 0.90556 870,737 2,397,088 26.36 2020 65 82,359 15,530 0. 18856 0.81144 753,384 1,526,351 18.53 2020 75 66,829 28,130 0.42093 0.57907 537,801 772,967 11.57 2020 85 38,699 35,044 0 235,166 235,166 6.08Number Number of of Number of Probability of |Probability of Person-years Expectation of Period Age (x) person-years survivor deaths ,, dy dying n x surviving nPx lived Ty life ex lived , 2017 0 100,000 674 0.00674 0.99326 496,952 7,860,751 78.61 2017 5 99,326 134 0.00135 0.99865 992,663 7,363,799 74.14 2017 15 99,192 725 0.00731 0.99269 988,986 6,371,136 64.23 2017 25 98,467 1,304 0.01324 0.98676 978,522 5,382,150 54.66 2017 35 97,163 1,888 0.01943 0.98057 962,881 4,403,628 45.32 2017 45 95,275 3,737 0.03922 0.96078 936,641 3,440,747 36.11 2017 55 91,539 7,842 0.08567 0.91433 880,177 2,504,106 27.36 2017 65 83,696 14,278 0.17059 0.82941 773,097 1,623,929 19.40 2017 75 69,419 27,036 0.38946 0.61054 571,764 850,832 12.26 2017 85 42,383 35,044 1 0 279,068 279,068 6.58
Step by Step Solution
There are 3 Steps involved in it

Get step-by-step solutions from verified subject matter experts