Question: Appendix D Data Tables PART ONE: ITEMS FROM MEMBER SURVEY Which of the following AFC services have you utilized at least once in the last
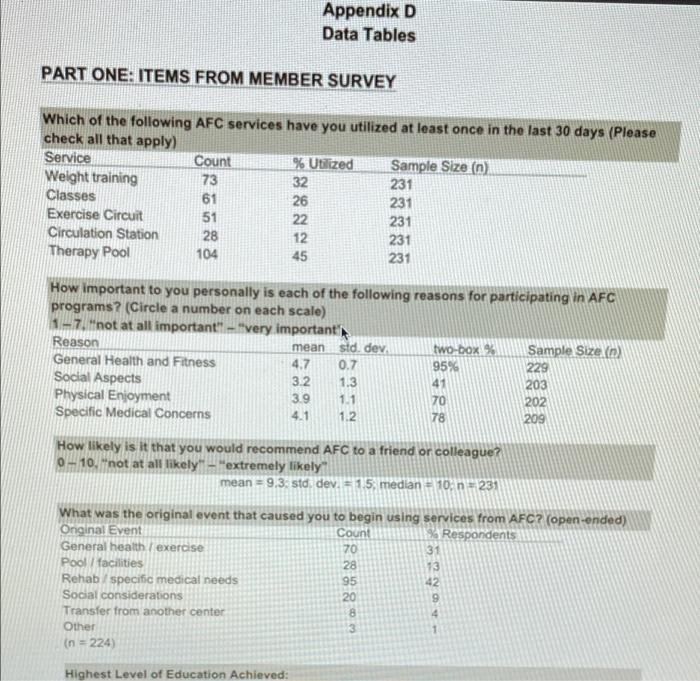
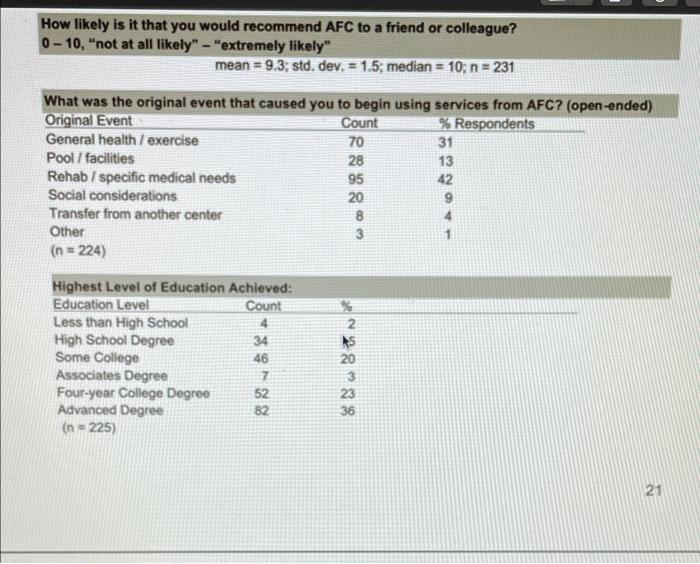
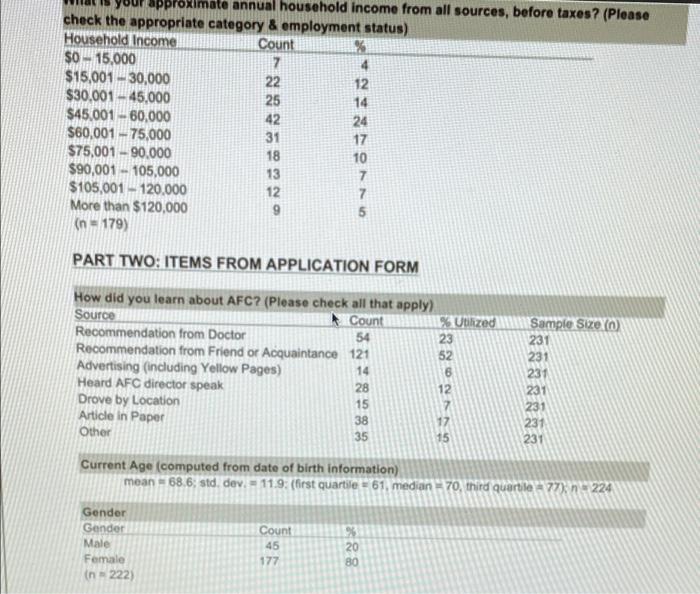
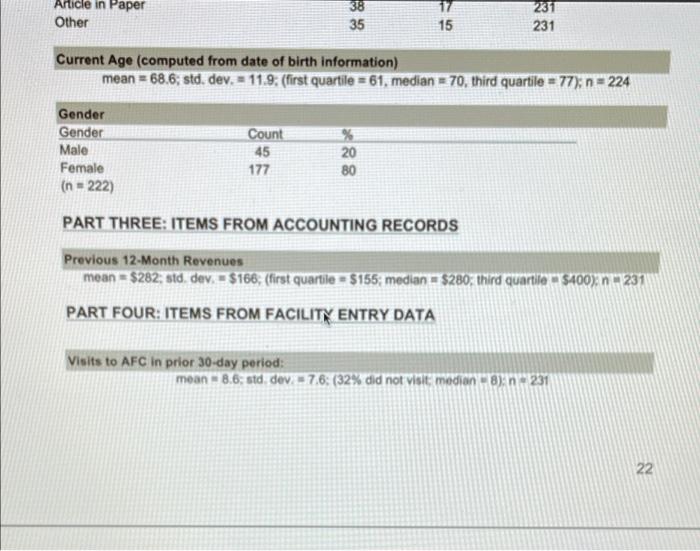
Appendix D Data Tables PART ONE: ITEMS FROM MEMBER SURVEY Which of the following AFC services have you utilized at least once in the last 30 days (Please check all that apply) Service Count % Utilized Sample Size (n) Weight training 73 32 231 Classes 61 26 231 Exercise Circuit 51 22 231 Circulation Station 28 12 231 Therapy Pool 104 45 231 How important to you personally is each of the following reasons for participating in AFC programs? (Circle a number on each scale) 1-7. not at all important - "very importanti Reason mean std. dev two-box % Sample Size(n) General Health and Fitness 4.7 0.7 95% 229 Social Aspects 3.2. 1.3 41 203 Physical Enjoyment 39 1.1 70 202 Specific Medical Concerns 4.1 1.2 78 209 How likely is it that you would recommend AFC to a friend or colleague? 0-10. not at all likely" - "extremely likely mean - 9.3. std. dev, 1.5, median - 10 n231 What was the original event that caused you to begin using services from AFC? (open-ended) Onginal Event Count % Respondents General health exercise 70 31 Pool / facilities 28 13 Rehab / specific medical needs 95 42 Social considerations 20 9 Transfer from another center 8 4 Other 1 (n = 224 w 3 Highest Level of Education Achieved: a How likely is it that you would recommend AFC to a friend or colleague? 0-10, "not at all likely" - "extremely likely" mean = 9.3; std. dev. = 1.5, median = 10; n = 231 What was the original event that caused you to begin using services from AFC? (open-ended) Original Event Count % Respondents General health / exercise 70 31 Pool/ facilities 28 13 Rehab / specific medical needs 95 42 Social considerations 20 9 Transfer from another center Other (n = 224) w Highest level of Education Achieved: Education Level Count Less than High School 4 High School Degree 34 Some College 46 Associates Degree Four-year College Degree 52 Advanced Degree 82 (n-225) %2b88% . 5 20 3 23 36 7 21 your approximate annual household income from all sources, before taxes? (Please check the appropriate category & employment status) Household Income Count % $0 - 15.000 7 4 $15,001 - 30,000 22 12 $30,001 - 45,000 25 14 $45,001 - 60,000 42 24 $60,001 - 75,000 31 17 $75,001 - 90.000 18 10 $90,001 - 105,000 13 7 $105,001 - 120.000 12 7 More than $120,000 9 5 In - 179) PART TWO: ITEMS FROM APPLICATION FORM How did you learn about AFC? (Please check all that apply) Source Count Utilized Recommendation from Doctor 54 23 Recommendation from Friend or Acquaintance 121 52 Advertising (including Yellow Pages) 14 6 Heard AFC director speak 28 12 Drove by Location 15 7 Article in Paper 38 17 Other 35 abern Sample Size o 231 231 231 231 231 231 231 15 Current Age (computed from date of birth information) mean - 68.6; std dev. = 11.9: (first quartile-61, median: 70, third quartie : 77), n224 Gender Gender Male Female in 222) Count 45 177 % 20 80 Article in Paper Other 231 231 35 15 Current Age (computed from date of birth information) mean = 68.6; std. dev. - 11.9. (first quartile = 61, median = 70, third quartile = 77); n = 224 Gender Gender Male Female (n = 222) Count 45 177 *&8 20 80 PART THREE: ITEMS FROM ACCOUNTING RECORDS Previous 12-Month Revenues mean = $282; std. dev = $166, (first quartile - $155; median = $280, third quartier $400) 231 PART FOUR: ITEMS FROM FACILITY ENTRY DATA Visits to AFC In prior 30-day period: mean = 8.6; std dev = 7.6; (32% did not visit median 8231 22 Once you entered the data inte SPSS and save the then spss. You could also import the data io SPSS to save time The data is collected using the questionnaire on page 250 or in Appendix A on page 32in the text. The explanation for each Variable in the date de inoperdiepe 120. in your doctite Statistics course, you must have used SPSS or some other software. Pe le SPSS or whatever software you learned in that counter the following Please produce a table that do the same as Part One of a Tables in Appendix D on page 18 and to partion of page Of course, you could simply copy that tible, but that is not the purpose of oria assignment Please conduct necessary analyses using SPSS or whatever software you learned in your introduction to statistics coure, which are necessary to produce the table in the il B) Please submit a report that contains your table from step as well as your output from step in your output strom step we the for you to come up with the table in Appendix D Data Tables PART ONE: ITEMS FROM MEMBER SURVEY Which of the following AFC services have you utilized at least once in the last 30 days (Please check all that apply) Service Count % Utilized Sample Size (n) Weight training 73 32 231 Classes 61 26 231 Exercise Circuit 51 22 231 Circulation Station 28 12 231 Therapy Pool 104 45 231 How important to you personally is each of the following reasons for participating in AFC programs? (Circle a number on each scale) 1-7. not at all important - "very importanti Reason mean std. dev two-box % Sample Size(n) General Health and Fitness 4.7 0.7 95% 229 Social Aspects 3.2. 1.3 41 203 Physical Enjoyment 39 1.1 70 202 Specific Medical Concerns 4.1 1.2 78 209 How likely is it that you would recommend AFC to a friend or colleague? 0-10. not at all likely" - "extremely likely mean - 9.3. std. dev, 1.5, median - 10 n231 What was the original event that caused you to begin using services from AFC? (open-ended) Onginal Event Count % Respondents General health exercise 70 31 Pool / facilities 28 13 Rehab / specific medical needs 95 42 Social considerations 20 9 Transfer from another center 8 4 Other 1 (n = 224 w 3 Highest Level of Education Achieved: a How likely is it that you would recommend AFC to a friend or colleague? 0-10, "not at all likely" - "extremely likely" mean = 9.3; std. dev. = 1.5, median = 10; n = 231 What was the original event that caused you to begin using services from AFC? (open-ended) Original Event Count % Respondents General health / exercise 70 31 Pool/ facilities 28 13 Rehab / specific medical needs 95 42 Social considerations 20 9 Transfer from another center Other (n = 224) w Highest level of Education Achieved: Education Level Count Less than High School 4 High School Degree 34 Some College 46 Associates Degree Four-year College Degree 52 Advanced Degree 82 (n-225) %2b88% . 5 20 3 23 36 7 21 your approximate annual household income from all sources, before taxes? (Please check the appropriate category & employment status) Household Income Count % $0 - 15.000 7 4 $15,001 - 30,000 22 12 $30,001 - 45,000 25 14 $45,001 - 60,000 42 24 $60,001 - 75,000 31 17 $75,001 - 90.000 18 10 $90,001 - 105,000 13 7 $105,001 - 120.000 12 7 More than $120,000 9 5 In - 179) PART TWO: ITEMS FROM APPLICATION FORM How did you learn about AFC? (Please check all that apply) Source Count Utilized Recommendation from Doctor 54 23 Recommendation from Friend or Acquaintance 121 52 Advertising (including Yellow Pages) 14 6 Heard AFC director speak 28 12 Drove by Location 15 7 Article in Paper 38 17 Other 35 abern Sample Size o 231 231 231 231 231 231 231 15 Current Age (computed from date of birth information) mean - 68.6; std dev. = 11.9: (first quartile-61, median: 70, third quartie : 77), n224 Gender Gender Male Female in 222) Count 45 177 % 20 80 Article in Paper Other 231 231 35 15 Current Age (computed from date of birth information) mean = 68.6; std. dev. - 11.9. (first quartile = 61, median = 70, third quartile = 77); n = 224 Gender Gender Male Female (n = 222) Count 45 177 *&8 20 80 PART THREE: ITEMS FROM ACCOUNTING RECORDS Previous 12-Month Revenues mean = $282; std. dev = $166, (first quartile - $155; median = $280, third quartier $400) 231 PART FOUR: ITEMS FROM FACILITY ENTRY DATA Visits to AFC In prior 30-day period: mean = 8.6; std dev = 7.6; (32% did not visit median 8231 22 Once you entered the data inte SPSS and save the then spss. You could also import the data io SPSS to save time The data is collected using the questionnaire on page 250 or in Appendix A on page 32in the text. The explanation for each Variable in the date de inoperdiepe 120. in your doctite Statistics course, you must have used SPSS or some other software. Pe le SPSS or whatever software you learned in that counter the following Please produce a table that do the same as Part One of a Tables in Appendix D on page 18 and to partion of page Of course, you could simply copy that tible, but that is not the purpose of oria assignment Please conduct necessary analyses using SPSS or whatever software you learned in your introduction to statistics coure, which are necessary to produce the table in the il B) Please submit a report that contains your table from step as well as your output from step in your output strom step we the for you to come up with the table in