

Question: Appendix V Current Job Information Smoke Damage Comm. Water Damage Other Total Total Res. Comm. Res. Comm. Res. Comm. Res. 2,542.00 120,000.00 394.00 270,000.00
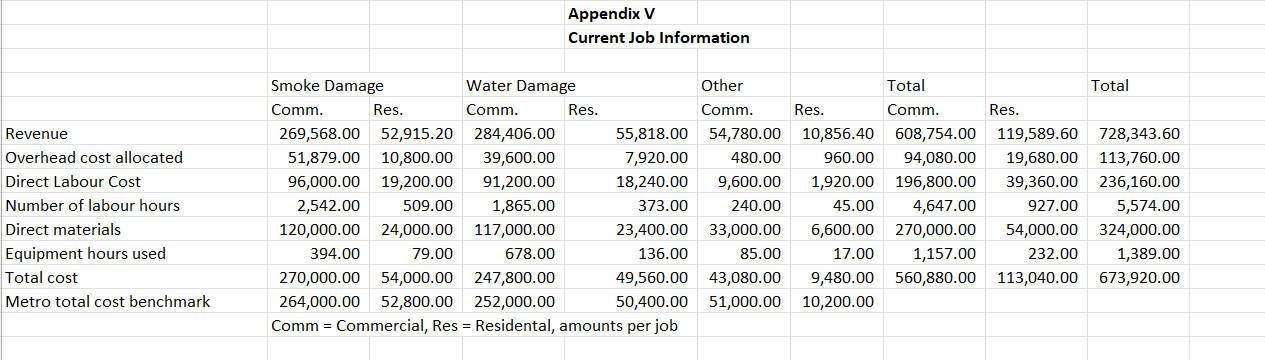
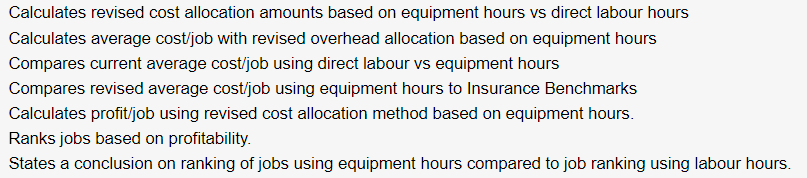
Appendix V Current Job Information Smoke Damage Comm. Water Damage Other Total Total Res. Comm. Res. Comm. Res. Comm. Res. 2,542.00 120,000.00 394.00 270,000.00 Revenue Overhead cost allocated Direct Labour Cost Number of labour hours Direct materials Equipment hours used Total cost Metro total cost benchmark 264,000.00 52,800.00 252,000.00 Comm = Commercial, Res = Residental, amounts per job 269,568.00 52,915.20 284,406.00 55,818.00 54,780.00 10,856.40 608,754.00 119,589.60 728,343.60 51,879.00 10,800.00 96,000.00 19,200.00 39,600.00 7,920.00 480.00 960.00 94,080.00 19,680.00 113,760.00 91,200.00 18,240.00 9,600.00 1,920.00 196,800.00 39,360.00 236,160.00 509.00 24,000.00 79.00 54,000.00 1,865.00 117,000.00 678.00 247,800.00 373.00 23,400.00 136.00 49,560.00 240.00 33,000.00 85.00 43,080.00 45.00 6,600.00 4,647.00 927.00 270,000.00 54,000.00 5,574.00 324,000.00 17.00 9,480.00 1,157.00 560,880.00 232.00 113,040.00 1,389.00 673,920.00 50,400.00 51,000.00 10,200.00 Calculates revised cost allocation amounts based on equipment hours vs direct labour hours Calculates average cost/job with revised overhead allocation based on equipment hours Compares current average cost/job using direct labour vs equipment hours Compares revised average cost/job using equipment hours to Insurance Benchmarks Calculates profit/job using revised cost allocation method based on equipment hours. Ranks jobs based on profitability. States a conclusion on ranking of jobs using equipment hours compared to job ranking using labour hours.
Step by Step Solution
There are 3 Steps involved in it
To calculate the revised cost allocation based on equipment hours vs direct ... View full answer

Get step-by-step solutions from verified subject matter experts