

Question: APPLE(AAPL) CREATING AN INDEX FOR STOCK PERFORMANCE COMPARISONS $ 10,000.00 NASDAQ Name of Stock (Ticker) Name of Industry 9 DATE PRICE INDEX VALUE INDEX VALUE
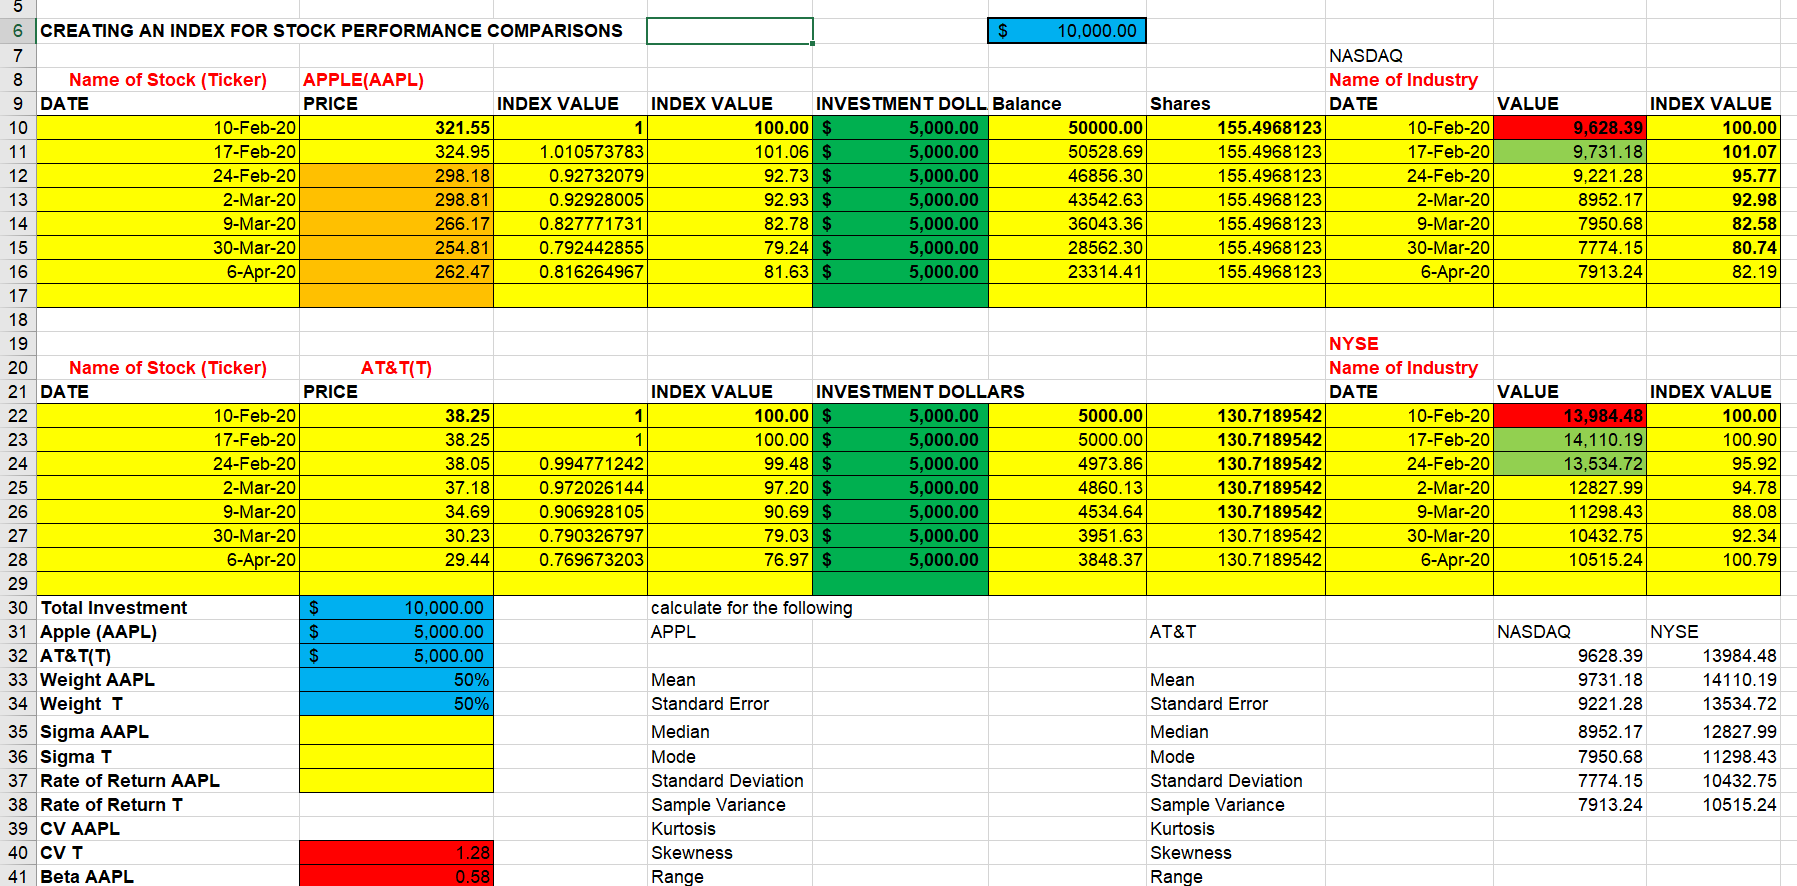
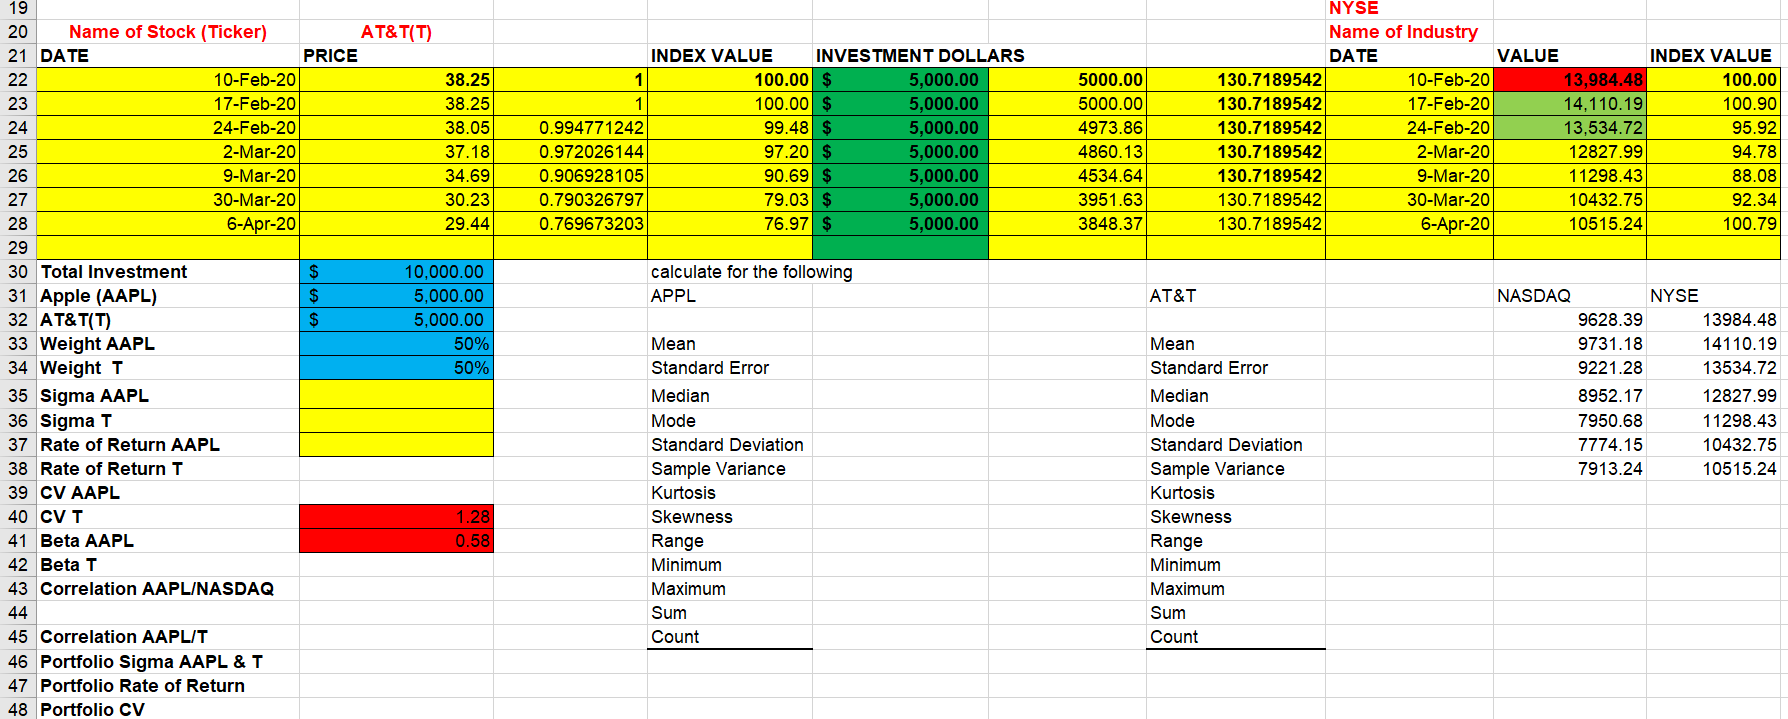
APPLE(AAPL) CREATING AN INDEX FOR STOCK PERFORMANCE COMPARISONS $ 10,000.00 NASDAQ Name of Stock (Ticker) Name of Industry 9 DATE PRICE INDEX VALUE INDEX VALUE INVESTMENT DOLL Balance Shares DATE VALUE 10-Feb-20 321.55 100.00 $ 5,000.00 50000.00 155.4968123 10-Feb-20 17-Feb-20 324.95 1.010573783 101.06 $ 5,000.00 50528.69 155.4968123 17-Feb-20 24-Feb-20 298.18 0.92732079 92.73 $ 5,000.00 46856.30 155.4968123 24-Feb-20 2-Mar-20 298.81 0.92928005 92.93 $ 5,000.00 43542.63 155.4968123 2-Mar-20 9-Mar-20 266.17 0.827771731 82.78 $ 5,000.00 36043.36 155.4968123 9-Mar-20 30-Mar-20 254.81 0.792442855 79.24 $ 5,000.00 28562.30 155.4968123 30-Mar-20 6-Apr-20 262.47 0.816264967 81.63 $ 5,000.00 23314.41 155.4968123 6-Apr-20| INDEX VALUE 9,628.39 100.00 9,731.18 101.07 9.221.28 95.77 8952.17 92.98 7950.68 82.58 7774.15 80.74 7913.24 82.19 INDEX VALUE INVESTMENT DOLLARS 1 100.00 $ 5,000.00 100.00 $ 5,000.00 0.994771242 99.48 $ 5,000.00 0.972026144 97.20 $ 5,000.00 0.906928105 90.69 $ 5,000.00 0.790326797 79.03 $ 5,000.00 0.769673203 76.97 $ 5,000.00 5000.00 5000.00 4973.86 4860.13 4534.64 3951.63 3848.37 NYSE Name of Industry DATE VALUE INDEX VALUE 130.7189542 10-Feb-20 13,984.48 100.00 130.7189542 17-Feb-20 14,110.19 100.90 130.7189542 24-Feb-20 13,534.72 95.92 130.7189542 2-Mar-20 12827.99 94.78 130.7189542 9-Mar-20 11298.43 88.08 130.7189542 30-Mar-20 10432.75 92.34 130.7189542 6-Apr-20 10515.24 100.79 Name of Stock (Ticker) AT&T(T) 21 DATE PRICE 10-Feb-20 38.25 17-Feb-20 38.25 24-Feb-20 38.05 2-Mar-20 37.18 9-Mar-20 34.69 30-Mar-20 30.23 6-Apr-20 29.44 29 30 Total Investment $ 10,000.00 31 Apple (AAPL) $ 5,000.00 32 AT&T(T) $ 5,000.00 33 Weight AAPL 50% 34 Weight T 50% 35 Sigma AAPL 36 Sigma T 37 Rate of Return AAPL 38 Rate of Return T 39 CV AAPL 40 CVT 1.28 41 Beta AAPL 0.58 calculate for the following APPL AT&T Mean Standard Error Median Mode Standard Deviation Sample Variance Kurtosis Skewness Range Mean Standard Error Median Mode Standard Deviation Sample Variance Kurtosis Skewness Range NASDAQ NYSE 9628.39 13984.48 9731.18 14110.19 9221.28 13534.72 8952.17 12827.99 7950.68 11298.43 7774.15 10432.75 7913.24 10515.24 INDEX VALUE INVESTMENT DOLLARS 1 100.00 $ 5,000.00 100.00 $ 5,000.00 0.994771242 99.48 $ 5,000.00 0.972026144 97.20 $ 5,000.00 0.906928105 90.69 $ 5,000.00 0.790326797 79.03 $ 5,000.00 0.769673203 76.97 $ 5,000.00 5000.00 5000.00 4973.86 4860.13 4534.64 3951.63 3848.37 NYSE Name of Industry DATE VALUE INDEX VALUE 130.7189542 10-Feb-20 13,984.48 100.00 130.7189542 17-Feb-20 14,110.19 100.90 130.7189542 24-Feb-20 13,534.72 95.92 130.7189542 2-Mar-20 12827.99 94.78 130.7189542 9-Mar-20 11298.43| 88.08 130.7189542 30-Mar-20 10432.75 92.34 130.7189542 6-Apr-20 10515.24 100.79 calculate for the following APPL AT&T 19 20 Name of Stock (Ticker) AT&T(T) 21 DATE PRICE 10-Feb-20 38.25 17-Feb-20 38.25 24-Feb-20 38.05 2-Mar-20 37.18 9-Mar-20 34.69 30-Mar-20 30.23 6-Apr-20 29.44 29 30 Total Investment $ 10,000.00 31 Apple (AAPL) $ 5,000.00 32 AT&T(T) $ 5,000.00 33 Weight AAPL 50% 34 Weight T 50% 35 Sigma AAPL 36 Sigma T 37 Rate of Return AAPL 38 Rate of Return T 39 CV AAPL 40 CVT 1.28 41 Beta AAPL 0.58 42 Beta T 43 Correlation AAPL/NASDAQ 44 45 Correlation AAPL/T 46 Portfolio Sigma AAPL&T 47 Portfolio Rate of Return 48 Portfolio CV NASDAQ NYSE 9628.39 13984.48 9731.18 14110.19 9221.28 13534.72 8952.17 12827.99 7950.68 11298.43 7774.15 10432.75 7913.24 10515.24 Mean Standard Error Median Mode Standard Deviation Sample Variance Kurtosis Skewness Range Minimum Maximum Sum Count Mean Standard Error Median Mode Standard Deviation Sample Variance Kurtosis Skewness Range Minimum Maximum Sum Count APPLE(AAPL) CREATING AN INDEX FOR STOCK PERFORMANCE COMPARISONS $ 10,000.00 NASDAQ Name of Stock (Ticker) Name of Industry 9 DATE PRICE INDEX VALUE INDEX VALUE INVESTMENT DOLL Balance Shares DATE VALUE 10-Feb-20 321.55 100.00 $ 5,000.00 50000.00 155.4968123 10-Feb-20 17-Feb-20 324.95 1.010573783 101.06 $ 5,000.00 50528.69 155.4968123 17-Feb-20 24-Feb-20 298.18 0.92732079 92.73 $ 5,000.00 46856.30 155.4968123 24-Feb-20 2-Mar-20 298.81 0.92928005 92.93 $ 5,000.00 43542.63 155.4968123 2-Mar-20 9-Mar-20 266.17 0.827771731 82.78 $ 5,000.00 36043.36 155.4968123 9-Mar-20 30-Mar-20 254.81 0.792442855 79.24 $ 5,000.00 28562.30 155.4968123 30-Mar-20 6-Apr-20 262.47 0.816264967 81.63 $ 5,000.00 23314.41 155.4968123 6-Apr-20| INDEX VALUE 9,628.39 100.00 9,731.18 101.07 9.221.28 95.77 8952.17 92.98 7950.68 82.58 7774.15 80.74 7913.24 82.19 INDEX VALUE INVESTMENT DOLLARS 1 100.00 $ 5,000.00 100.00 $ 5,000.00 0.994771242 99.48 $ 5,000.00 0.972026144 97.20 $ 5,000.00 0.906928105 90.69 $ 5,000.00 0.790326797 79.03 $ 5,000.00 0.769673203 76.97 $ 5,000.00 5000.00 5000.00 4973.86 4860.13 4534.64 3951.63 3848.37 NYSE Name of Industry DATE VALUE INDEX VALUE 130.7189542 10-Feb-20 13,984.48 100.00 130.7189542 17-Feb-20 14,110.19 100.90 130.7189542 24-Feb-20 13,534.72 95.92 130.7189542 2-Mar-20 12827.99 94.78 130.7189542 9-Mar-20 11298.43 88.08 130.7189542 30-Mar-20 10432.75 92.34 130.7189542 6-Apr-20 10515.24 100.79 Name of Stock (Ticker) AT&T(T) 21 DATE PRICE 10-Feb-20 38.25 17-Feb-20 38.25 24-Feb-20 38.05 2-Mar-20 37.18 9-Mar-20 34.69 30-Mar-20 30.23 6-Apr-20 29.44 29 30 Total Investment $ 10,000.00 31 Apple (AAPL) $ 5,000.00 32 AT&T(T) $ 5,000.00 33 Weight AAPL 50% 34 Weight T 50% 35 Sigma AAPL 36 Sigma T 37 Rate of Return AAPL 38 Rate of Return T 39 CV AAPL 40 CVT 1.28 41 Beta AAPL 0.58 calculate for the following APPL AT&T Mean Standard Error Median Mode Standard Deviation Sample Variance Kurtosis Skewness Range Mean Standard Error Median Mode Standard Deviation Sample Variance Kurtosis Skewness Range NASDAQ NYSE 9628.39 13984.48 9731.18 14110.19 9221.28 13534.72 8952.17 12827.99 7950.68 11298.43 7774.15 10432.75 7913.24 10515.24 INDEX VALUE INVESTMENT DOLLARS 1 100.00 $ 5,000.00 100.00 $ 5,000.00 0.994771242 99.48 $ 5,000.00 0.972026144 97.20 $ 5,000.00 0.906928105 90.69 $ 5,000.00 0.790326797 79.03 $ 5,000.00 0.769673203 76.97 $ 5,000.00 5000.00 5000.00 4973.86 4860.13 4534.64 3951.63 3848.37 NYSE Name of Industry DATE VALUE INDEX VALUE 130.7189542 10-Feb-20 13,984.48 100.00 130.7189542 17-Feb-20 14,110.19 100.90 130.7189542 24-Feb-20 13,534.72 95.92 130.7189542 2-Mar-20 12827.99 94.78 130.7189542 9-Mar-20 11298.43| 88.08 130.7189542 30-Mar-20 10432.75 92.34 130.7189542 6-Apr-20 10515.24 100.79 calculate for the following APPL AT&T 19 20 Name of Stock (Ticker) AT&T(T) 21 DATE PRICE 10-Feb-20 38.25 17-Feb-20 38.25 24-Feb-20 38.05 2-Mar-20 37.18 9-Mar-20 34.69 30-Mar-20 30.23 6-Apr-20 29.44 29 30 Total Investment $ 10,000.00 31 Apple (AAPL) $ 5,000.00 32 AT&T(T) $ 5,000.00 33 Weight AAPL 50% 34 Weight T 50% 35 Sigma AAPL 36 Sigma T 37 Rate of Return AAPL 38 Rate of Return T 39 CV AAPL 40 CVT 1.28 41 Beta AAPL 0.58 42 Beta T 43 Correlation AAPL/NASDAQ 44 45 Correlation AAPL/T 46 Portfolio Sigma AAPL&T 47 Portfolio Rate of Return 48 Portfolio CV NASDAQ NYSE 9628.39 13984.48 9731.18 14110.19 9221.28 13534.72 8952.17 12827.99 7950.68 11298.43 7774.15 10432.75 7913.24 10515.24 Mean Standard Error Median Mode Standard Deviation Sample Variance Kurtosis Skewness Range Minimum Maximum Sum Count Mean Standard Error Median Mode Standard Deviation Sample Variance Kurtosis Skewness Range Minimum Maximum Sum Count
Step by Step Solution
There are 3 Steps involved in it

Get step-by-step solutions from verified subject matter experts