

Question: Application: 1. Given that marks last year in Data Management were Normally Distributed with p = 68 and SD = 4.5 Label the graph for

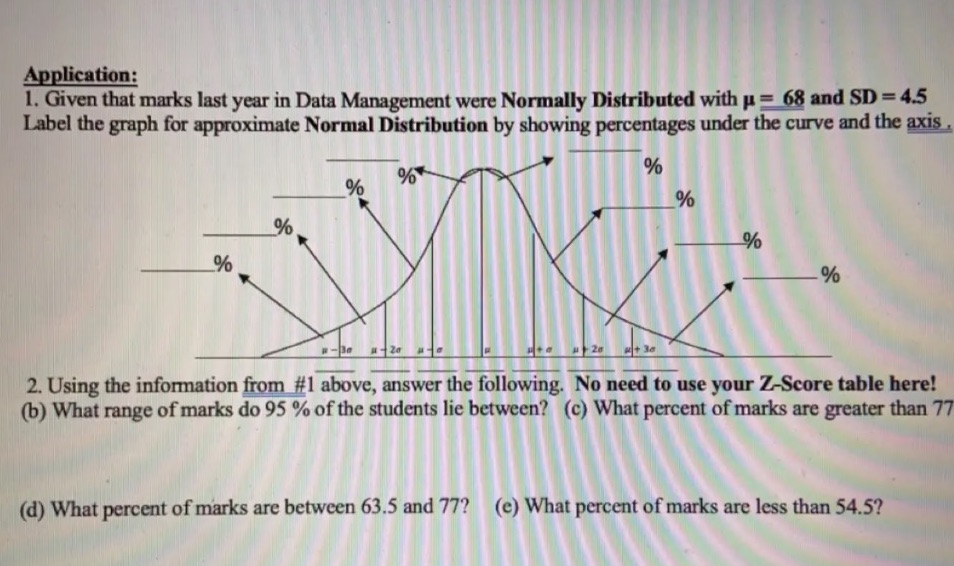
Application: 1. Given that marks last year in Data Management were Normally Distributed with p = 68 and SD = 4.5 Label the graph for approximate Normal Distribution by showing percentages under the curve and the axis % % % % % % % % + 3a 2. Using the information from #1 above, answer the following. No need to use your Z-Score table here! (b) What range of marks do 95 % of the students lie between? (c) What percent of marks are greater than 77 (d) What percent of marks are between 63.5 and 77? (e) What percent of marks are less than 54.5
Step by Step Solution
There are 3 Steps involved in it
1 Expert Approved Answer
Step: 1 Unlock

Question Has Been Solved by an Expert!
Get step-by-step solutions from verified subject matter experts
Step: 2 Unlock
Step: 3 Unlock