

Question: Application Problem 12-1A a-b (Common-size analysis and differences in profitability) Comparative financial statement data for First Ltd. and Supreme Ltd., two competitors, follow: Net sales
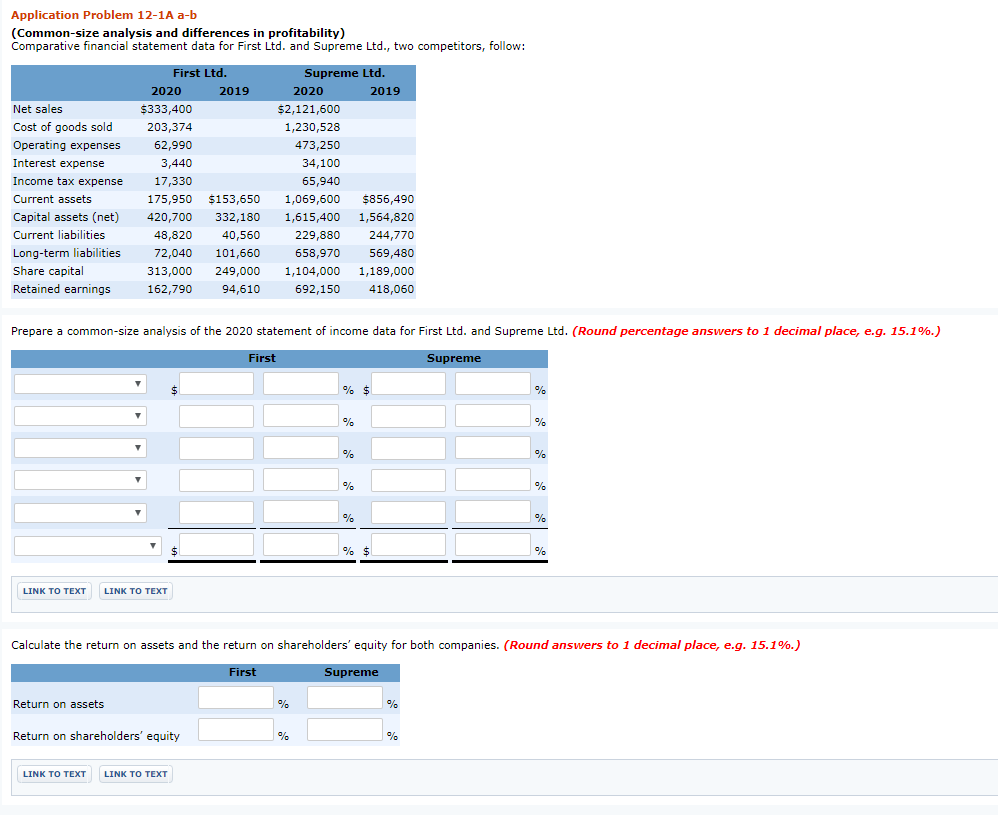
Application Problem 12-1A a-b (Common-size analysis and differences in profitability) Comparative financial statement data for First Ltd. and Supreme Ltd., two competitors, follow: Net sales Cost of goods sold Operating expenses Interest expense Income tax expense Current assets Capital assets (net) Current liabilities Long-term liabilities Share capital Retained earnings First Ltd. 2020 2019 $333,400 203,374 62,990 3,440 17,330 175,950 $153,650 420,700 332,180 48,820 40,560 72,040 101,660 313,000 249,000 162,790 94,610 Supreme Ltd. 2020 2019 $2,121,600 1,230,528 473,250 34,100 65,940 1,069,600 $856,490 1,615,400 1,564,820 229,880 244,770 658,970 569,480 1,104,000 1,189,000 692,150 418,060 Prepare a common-size analysis of the 2020 statement of income data for First Ltd. and Supreme Ltd. (Round percentage answers to 1 decimal place, e.g. 15.1%.) First Supreme LINK TO TEXT LINK TO TEXT Calculate the return on assets and the return on shareholders' equity for both companies. (Round answers to 1 decimal place, e.g. 15.1%.) First Supreme Return on assets Return on shareholders' equity LINK TO TEXT LINK TO TEXT
Step by Step Solution
There are 3 Steps involved in it

Get step-by-step solutions from verified subject matter experts