Question: APPLIED EXPERIMENTAL DESIGN Show all work and use the attached Routput to help you answer questions (when relevant). 1. (50 pts) A sensory experiment was
APPLIED EXPERIMENTAL DESIGN

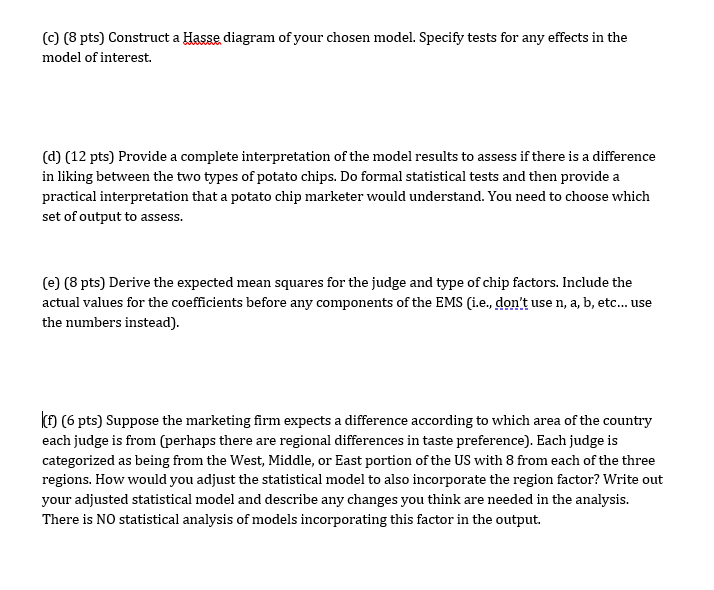
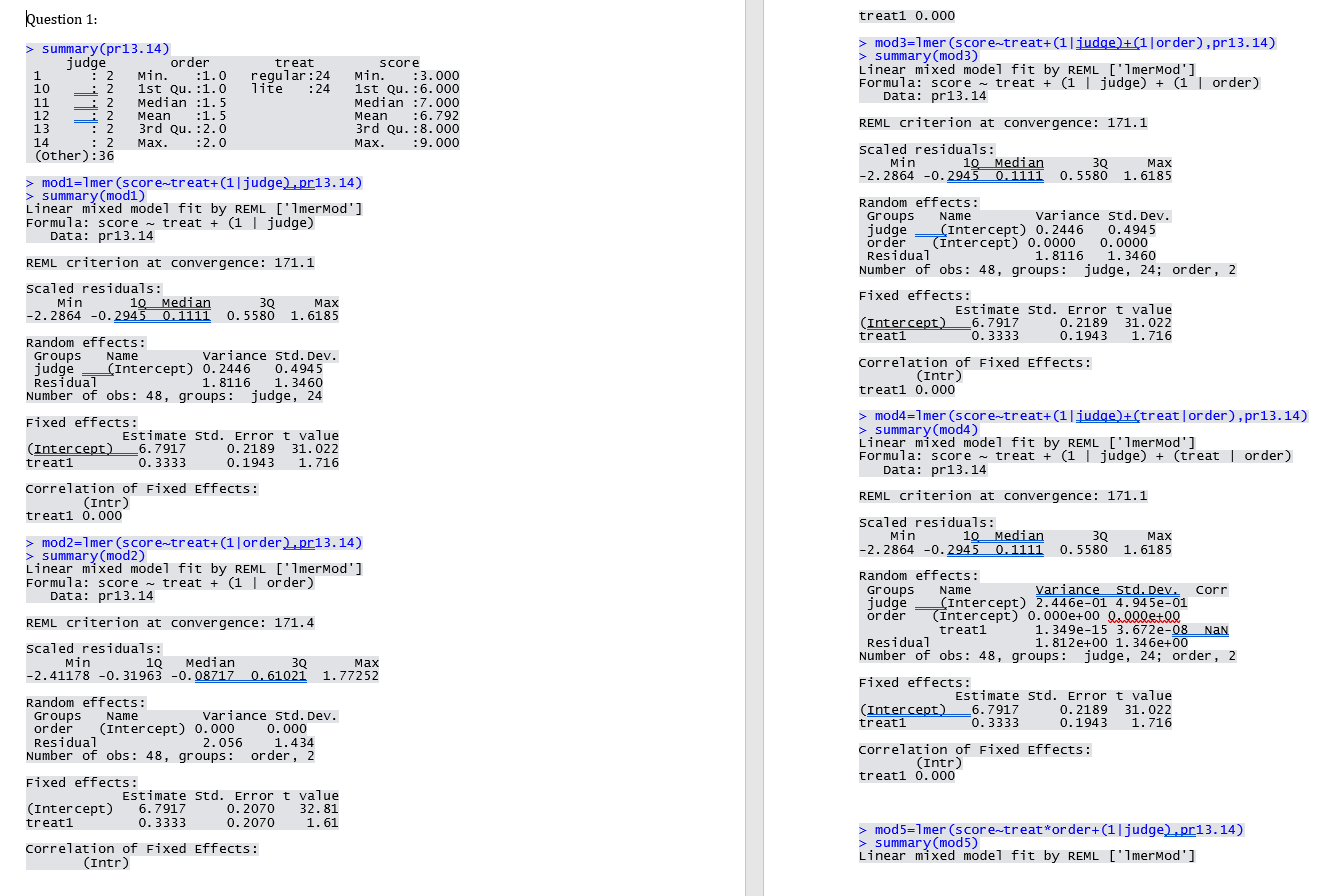
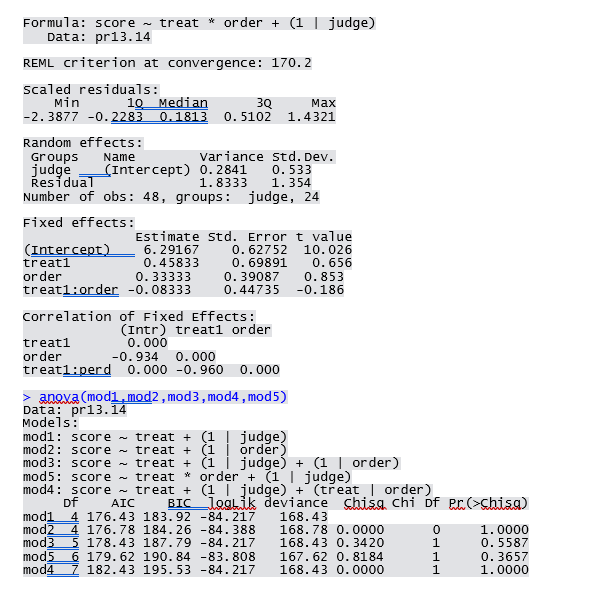
Show all work and use the attached Routput to help you answer questions (when relevant). 1. (50 pts) A sensory experiment was conducted to determine if consumers have a preference between regular potato chips (A) and reduced-fat potato chips (B). Twenty-four judges will rate both types of chips; twelve judges will rate the chips in the order regular fat, then reduced fat; and the other twelve will have the order reduced fat, then regular fat. We anticipate judge to judge differences and possible differences between the first and second chips tasted. The response is a scale, with higher scores indicating greater liking: 4 6 8 Judge A first B second 1 8 6 2 5 6 3 7 8 5 7 4 7 4 8 9 7 7 9 8 9 10 7 7 11 7 5 12 7 3 8 8 9 24 Judge B first A second 13 4 7 14 6 8 15 6 7 16 7 8 17 6 4 18 4 19 8 7 20 6 7 21 7 7 22 6 23 8 8 8 8 8 Answer the following questions based on this scenario and using the attached Routput. (a) (8 pts) There are several ways you could address the factors in this experiment. If we regard type of chip, judge and order as factors, define which should be random and which should be fixed in the statistical model. Justify your choice. (b) (8 pts) Choose a statistical model among the five provided in the output. Justify your choice based on design and fit considerations. Make sure you identify any blocking factors if present. c) (8 pts) Construct a Hasse diagram of your chosen model. Specify tests for any effects in the model of interest. (d) (12 pts) Provide a complete interpretation of the model results to assess if there is a difference in liking between the two types of potato chips. Do formal statistical tests and then provide a practical interpretation that a potato chip marketer would understand. You need to choose which set of output to assess. (e) (8 pts) Derive the expected mean squares for the judge and type of chip factors. Include the actual values for the coefficients before any components of the EMS (i.e., don't use n, a, b, etc... use the numbers instead). (F) (6 pts) Suppose the marketing firm expects a difference according to which area of the country each judge is from (perhaps there are regional differences in taste preference). Each judge is categorized as being from the West, Middle, or East portion of the US with 8 from each of the three regions. How would you adjust the statistical model to also incorporate the region factor? Write out your adjusted statistical model and describe any changes you think are needed in the analysis. There is NO statistical analysis of models incorporating this factor in the output. treat1 0.000 Question 1: > summary (pr13.14) judge order 1 2 Min. :1.0 10 1st Qu. :1.0 11 - 2 Median :1.5 12 -2 Mean :1.5 13 : 2 3rd Qu. :2.0 14 : 2 Max. :2.0 (other):36 treat regular:24 lite :24 score Min. :3.000 1st Qu. :6.000 Median :7.000 Mean :6.792 3rd Qu.: 8.000 Max. :9.000 > modl=lmer (score-treat+(1 judge.pr13.14) > summary (modi) Linear mixed model fit by REML ['Imermod'] Formula: score - treat + (1 | judge) Data: pr13. 14 REML criterion at convergence: 171.1 Scaled residuals: Min 10 Median 30 Max -2.2864 -0.2945 0.1111 0.5580 1.6185 Random effects: Groups Name Variance std. Dev. judge (Intercept) 0.2446 0.4945 Residual 1.8116 1. 3460 Number of obs: 48, groups: judge, 24 Fixed effects: Estimate Std. Error t value (Intercept) 6.7917 0.2189 31.022 treati 0.3333 0.1943 1.71 correlation of Fixed Effects: (Intr) treati 0.000 > mod3=1mer (score-treat+(1judge +(1 order), pr13.14) > summary (mod3) Linear mixed model fit by REML ['lmerMod'] Formula: score - treat + (1 | judge) + (1 | order) Data: pr13.14 REML criterion at convergence: 171.1 Scaled residuals: Min 10 Median 39 Max -2.2864 -0.2945 0.1111 0.5580 1.6185 Random effects: Groups Name Variance std. Dev. judge (Intercept) 0.2446 0.4945 order (Intercept) 0.0000 0.0000 Residual 1.8116 1. 3460 Number of obs: 48, groups: judge, 24; order, 2 Fixed effects: Estimate Std. Error t value (Intercept) -6.7917 0.2189 31.022 treat1 0.3333 0.1943 1.716 Correlation of Fixed Effects: (Intr) treat1 0.000 > mod4=lmer (score-treat+(1 judge +(treat order), pr13.14) > summary(mod4) Linear mixed model fit by REML ['ImerMod'] Formula: score - treat + (1 | judge) + (treat | order) Data: pr13.14 REML criterion at convergence: 171.1 > mod2=1mer (score-treat+(1 order.pr13. 14) > summary(mod2) Linear mixed model fit by REML ['Imermod'] Formula: score - treat + (1 | order) Data: pr13.14 REML criterion at convergence: 171.4 Scaled residuals: Min 19 Median 30 -2.41178 -0.31963 -0.08717 0.61021 1.77252 Scaled residuals: Min 10 Median 30 Max -2.2864 -0.2945 0.1111 0.5580 1.6185 Random effects: Groups Name Variance std. Dev. Corr judge (Intercept) 2.446e-01 4.945e-01 order (Intercept) 0.000e+00 0.000e+00 treat1 1.349e-15 3.672e-08 NAN Residual 1.812e+00 1. 346e+00 Number of obs: 48, groups: judge, 24; order, 2 Fixed effects: Estimate Std. Error t value (Intercept) 6.7917 0.2189 31.022 treat1 0.3333 0.1943 1.716 Correlation of Fixed Effects: (Intr) treati 0.000 Random effects: Groups Name Variance std. Dev. order (Intercept) 0.000 0.000 Residual 2.056 1.434 Number of obs: 48, groups: order, 2 Fixed effects: Estimate Std. Error t value (Intercept) 6.7917 0.2070 32.81 treati 0.3333 0. 2070 1.61 Correlation of Fixed Effects: (Intr) > mod5=7mer (score-treat*order+(1| judge..pr13.14) > summary(mod5) Linear mixed model fit by REML ['Imermod'] Formula: score - treat * order + (1 | judge) Data: pr13.14 REML criterion at convergence: 170.2 Scaled residuals: Min 10 Median 30 Max -2.3877 -0.2283 0.1813 0.5102 1.4321 Random effects: Groups Name Variance Std. Dev. judge (Intercept) 0.2841 0.533 Residual 1.8333 1.354 Number of obs: 48, groups: judge, 24 Fixed effects: Estimate std. Error t value (Intercept) 6. 29167 0.62752 10.026 treat1 0.45833 0.69891 0.656 order 0.33333 0.39087 0.853 treati:order -0.08333 0.44735 -0.186 Correlation of Fixed Effects: (Intr) treat1 order treat1 0.000 order -0.934 0.000 treat1:perd 0.000 -0.9600.000 > anexa (modi, mod2, mod3, mod4, mod5) Data: pr13.14 Models: modi: score - treat + (1 judge) mod2: score - treat + (1 | order) mod3: score - treat + (1 I judge) + (1 | order) mod5: score - treat * order + (1 | judge) mod4: score - treat + (1 l judge) + (treat | order) Df AIC BIC loglik deviance shisg chi of Pr>Chisg) modi 4 176.43 183.92 -84.217 168.43 mod2 4 176.78 184.26 -84.388 168.78 0.0000 0 1.0000 mod3 5 178.43 187.79 -84.217 168.43 0.3420 1 0.5587 mod5 6 179.62 190.84 -83.808 167.62 0.8184 1 0.3657 mod4 Z 182.43 195.53 -84.217 168.43 0.0000 1 1.0000 Show all work and use the attached Routput to help you answer questions (when relevant). 1. (50 pts) A sensory experiment was conducted to determine if consumers have a preference between regular potato chips (A) and reduced-fat potato chips (B). Twenty-four judges will rate both types of chips; twelve judges will rate the chips in the order regular fat, then reduced fat; and the other twelve will have the order reduced fat, then regular fat. We anticipate judge to judge differences and possible differences between the first and second chips tasted. The response is a scale, with higher scores indicating greater liking: 4 6 8 Judge A first B second 1 8 6 2 5 6 3 7 8 5 7 4 7 4 8 9 7 7 9 8 9 10 7 7 11 7 5 12 7 3 8 8 9 24 Judge B first A second 13 4 7 14 6 8 15 6 7 16 7 8 17 6 4 18 4 19 8 7 20 6 7 21 7 7 22 6 23 8 8 8 8 8 Answer the following questions based on this scenario and using the attached Routput. (a) (8 pts) There are several ways you could address the factors in this experiment. If we regard type of chip, judge and order as factors, define which should be random and which should be fixed in the statistical model. Justify your choice. (b) (8 pts) Choose a statistical model among the five provided in the output. Justify your choice based on design and fit considerations. Make sure you identify any blocking factors if present. c) (8 pts) Construct a Hasse diagram of your chosen model. Specify tests for any effects in the model of interest. (d) (12 pts) Provide a complete interpretation of the model results to assess if there is a difference in liking between the two types of potato chips. Do formal statistical tests and then provide a practical interpretation that a potato chip marketer would understand. You need to choose which set of output to assess. (e) (8 pts) Derive the expected mean squares for the judge and type of chip factors. Include the actual values for the coefficients before any components of the EMS (i.e., don't use n, a, b, etc... use the numbers instead). (F) (6 pts) Suppose the marketing firm expects a difference according to which area of the country each judge is from (perhaps there are regional differences in taste preference). Each judge is categorized as being from the West, Middle, or East portion of the US with 8 from each of the three regions. How would you adjust the statistical model to also incorporate the region factor? Write out your adjusted statistical model and describe any changes you think are needed in the analysis. There is NO statistical analysis of models incorporating this factor in the output. treat1 0.000 Question 1: > summary (pr13.14) judge order 1 2 Min. :1.0 10 1st Qu. :1.0 11 - 2 Median :1.5 12 -2 Mean :1.5 13 : 2 3rd Qu. :2.0 14 : 2 Max. :2.0 (other):36 treat regular:24 lite :24 score Min. :3.000 1st Qu. :6.000 Median :7.000 Mean :6.792 3rd Qu.: 8.000 Max. :9.000 > modl=lmer (score-treat+(1 judge.pr13.14) > summary (modi) Linear mixed model fit by REML ['Imermod'] Formula: score - treat + (1 | judge) Data: pr13. 14 REML criterion at convergence: 171.1 Scaled residuals: Min 10 Median 30 Max -2.2864 -0.2945 0.1111 0.5580 1.6185 Random effects: Groups Name Variance std. Dev. judge (Intercept) 0.2446 0.4945 Residual 1.8116 1. 3460 Number of obs: 48, groups: judge, 24 Fixed effects: Estimate Std. Error t value (Intercept) 6.7917 0.2189 31.022 treati 0.3333 0.1943 1.71 correlation of Fixed Effects: (Intr) treati 0.000 > mod3=1mer (score-treat+(1judge +(1 order), pr13.14) > summary (mod3) Linear mixed model fit by REML ['lmerMod'] Formula: score - treat + (1 | judge) + (1 | order) Data: pr13.14 REML criterion at convergence: 171.1 Scaled residuals: Min 10 Median 39 Max -2.2864 -0.2945 0.1111 0.5580 1.6185 Random effects: Groups Name Variance std. Dev. judge (Intercept) 0.2446 0.4945 order (Intercept) 0.0000 0.0000 Residual 1.8116 1. 3460 Number of obs: 48, groups: judge, 24; order, 2 Fixed effects: Estimate Std. Error t value (Intercept) -6.7917 0.2189 31.022 treat1 0.3333 0.1943 1.716 Correlation of Fixed Effects: (Intr) treat1 0.000 > mod4=lmer (score-treat+(1 judge +(treat order), pr13.14) > summary(mod4) Linear mixed model fit by REML ['ImerMod'] Formula: score - treat + (1 | judge) + (treat | order) Data: pr13.14 REML criterion at convergence: 171.1 > mod2=1mer (score-treat+(1 order.pr13. 14) > summary(mod2) Linear mixed model fit by REML ['Imermod'] Formula: score - treat + (1 | order) Data: pr13.14 REML criterion at convergence: 171.4 Scaled residuals: Min 19 Median 30 -2.41178 -0.31963 -0.08717 0.61021 1.77252 Scaled residuals: Min 10 Median 30 Max -2.2864 -0.2945 0.1111 0.5580 1.6185 Random effects: Groups Name Variance std. Dev. Corr judge (Intercept) 2.446e-01 4.945e-01 order (Intercept) 0.000e+00 0.000e+00 treat1 1.349e-15 3.672e-08 NAN Residual 1.812e+00 1. 346e+00 Number of obs: 48, groups: judge, 24; order, 2 Fixed effects: Estimate Std. Error t value (Intercept) 6.7917 0.2189 31.022 treat1 0.3333 0.1943 1.716 Correlation of Fixed Effects: (Intr) treati 0.000 Random effects: Groups Name Variance std. Dev. order (Intercept) 0.000 0.000 Residual 2.056 1.434 Number of obs: 48, groups: order, 2 Fixed effects: Estimate Std. Error t value (Intercept) 6.7917 0.2070 32.81 treati 0.3333 0. 2070 1.61 Correlation of Fixed Effects: (Intr) > mod5=7mer (score-treat*order+(1| judge..pr13.14) > summary(mod5) Linear mixed model fit by REML ['Imermod'] Formula: score - treat * order + (1 | judge) Data: pr13.14 REML criterion at convergence: 170.2 Scaled residuals: Min 10 Median 30 Max -2.3877 -0.2283 0.1813 0.5102 1.4321 Random effects: Groups Name Variance Std. Dev. judge (Intercept) 0.2841 0.533 Residual 1.8333 1.354 Number of obs: 48, groups: judge, 24 Fixed effects: Estimate std. Error t value (Intercept) 6. 29167 0.62752 10.026 treat1 0.45833 0.69891 0.656 order 0.33333 0.39087 0.853 treati:order -0.08333 0.44735 -0.186 Correlation of Fixed Effects: (Intr) treat1 order treat1 0.000 order -0.934 0.000 treat1:perd 0.000 -0.9600.000 > anexa (modi, mod2, mod3, mod4, mod5) Data: pr13.14 Models: modi: score - treat + (1 judge) mod2: score - treat + (1 | order) mod3: score - treat + (1 I judge) + (1 | order) mod5: score - treat * order + (1 | judge) mod4: score - treat + (1 l judge) + (treat | order) Df AIC BIC loglik deviance shisg chi of Pr>Chisg) modi 4 176.43 183.92 -84.217 168.43 mod2 4 176.78 184.26 -84.388 168.78 0.0000 0 1.0000 mod3 5 178.43 187.79 -84.217 168.43 0.3420 1 0.5587 mod5 6 179.62 190.84 -83.808 167.62 0.8184 1 0.3657 mod4 Z 182.43 195.53 -84.217 168.43 0.0000 1 1.0000


