

Question: Apply the statistical techniques (descriptive statistics) studied in this course and completely describe your data set for both variables in the light of following questions:
Apply the statistical techniques (descriptive statistics) studied in this course and completely describe your data set for both variables in the light of following questions: Each (X,Y) has 20 observations.
Question 1.
a. Discuss the types and level of measurement of the variables in the data.
b. Prove that A.M>G. M>H.M (For both the variables).
c. Estimate the values of Q3, D7 and P49 and Interpret the results.
d. Compare Relative Dispersions of X and Y. Using (i) Quartile Coefficient of Dispersion and (ii) Coefficient of Variation.
e. Explain whether the above two measures in part (d) provide the same information.
f. Which Variable is more consistent.
g. Discuss the shape of the variables X and Y using results of Mean, Median and Mode.
h. Obtain skewness by Karl Pearson's formula, For which variable (X,Y) skewness is more sharp.
i. Obtain the Bowley's coefficient of skewness. Is there any change in the decision regarding the shape of the variables?
j. Draw a scatter plot of the data.
k. Obtain Pearson's coefficient of Correlation and interpret the results.
l. Discuss what changes will there be on the value of the correlation coefficient if we transform variables X (first variable in the data) and Y (second variable in the data) using the following expressions. will there be any change in the value of rxy, if so then why or if not then why, please discuss.
u= 5x+46 and v=3y+2
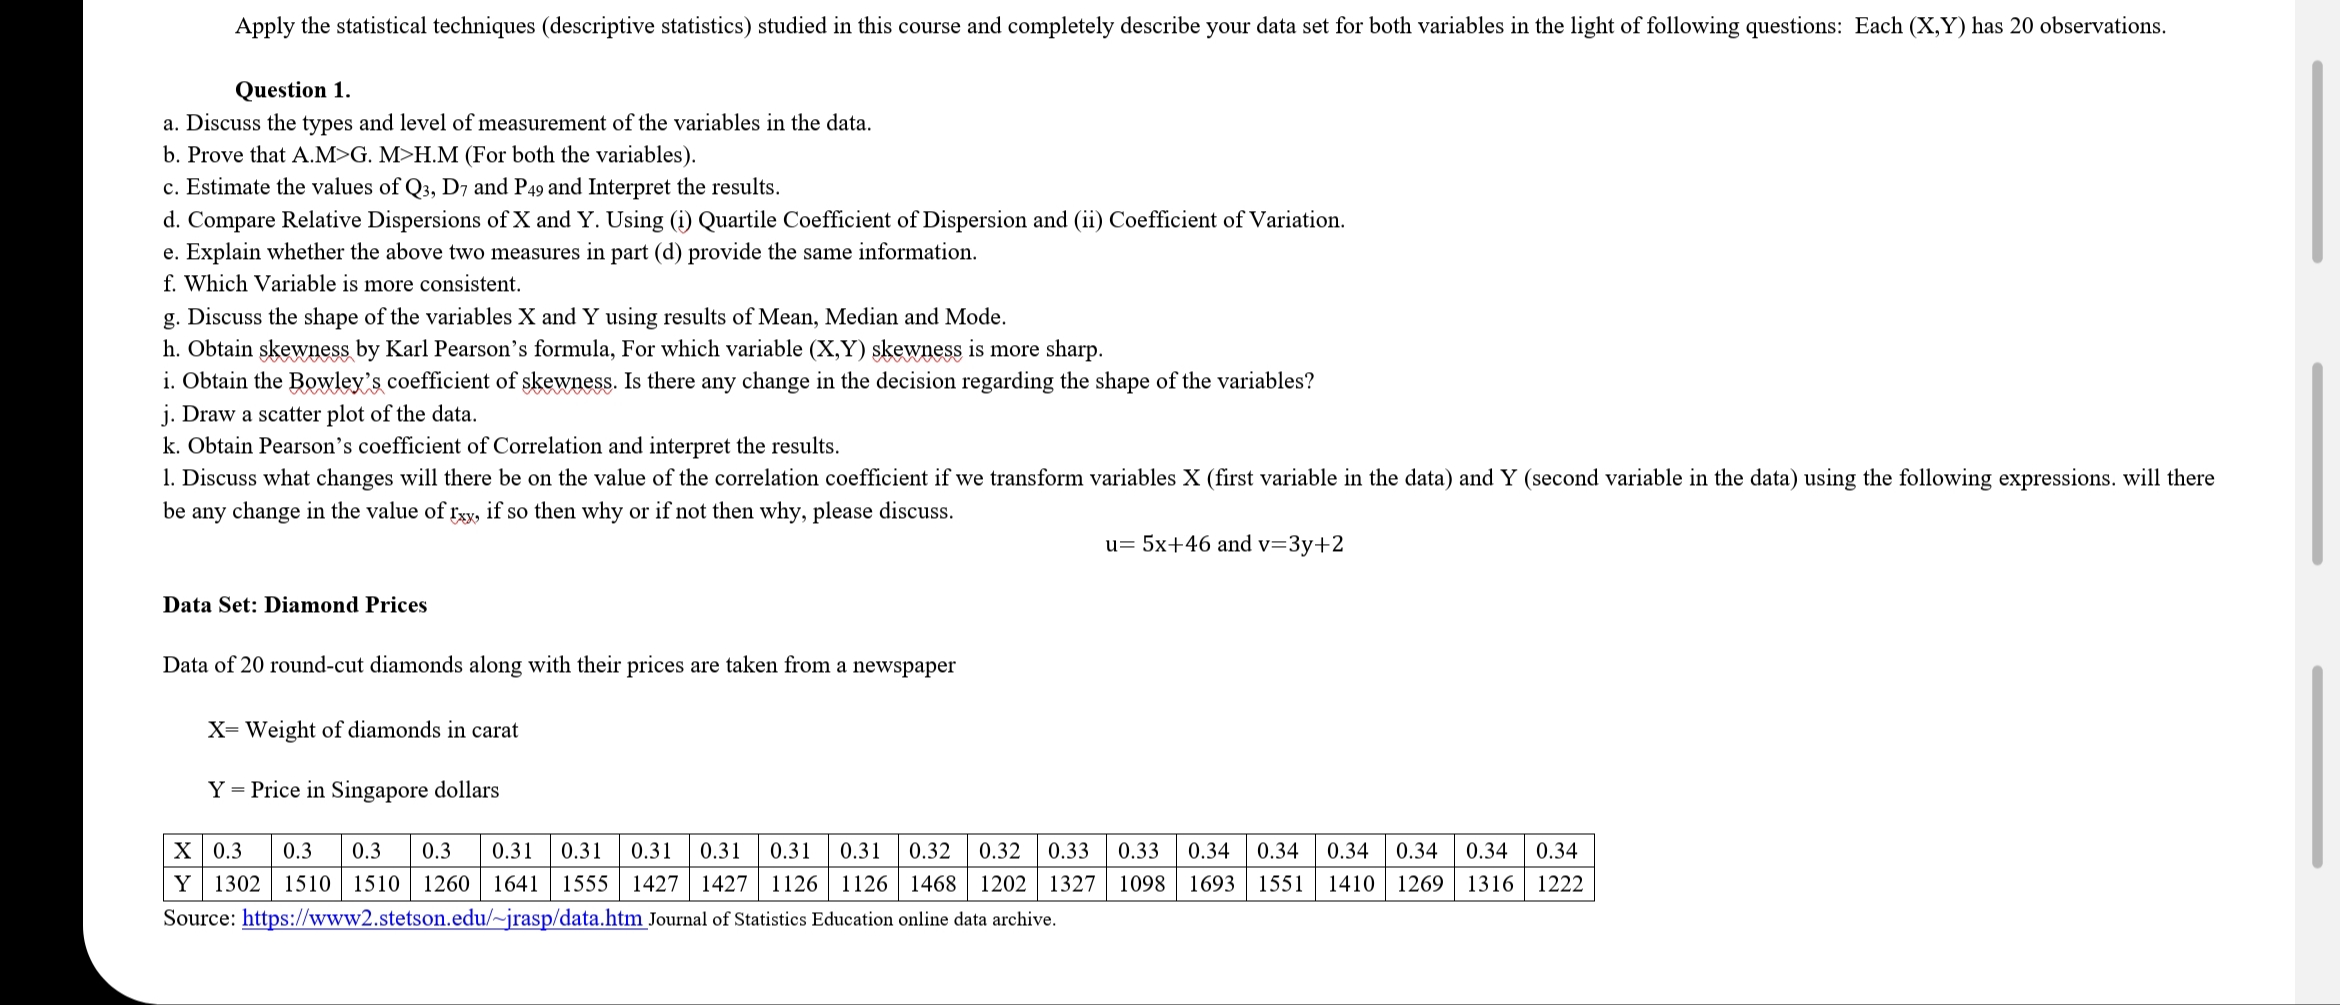
Data Set: Diamond Prices
Data of 20 round-cut diamonds along with their prices are taken from a newspaper
X= Weight of diamonds in carat
Y = Price in Singapore dollars
X 0.3, 0.3, 0.3, 0.3, 0.31, 0.31, 0.31, 0.31, 0.31, 0.31, 0.32, 0.32, 0.33, 0.33, 0.34, 0.34, 0.34, 0.34, 0.34, 0.34
Y 1302, 1510, 1510, 1260, 1641, 1555, 1427, 1427, 1126, 1126, 1468, 1202, 1327, 1098, 1693, 1551, 1410, 1269, 1316, 1222
Source: https://www2.stetson.edu/~jrasp/data.htm Journal of Statistics Education online data archive.
Apply the statistical techniques (descriptive statistics) studied in this course and completely describe your data set for both variables in the light of following questions: Each (X,Y) has 20 observations. Question 1. a. Discuss the types and level of measurement of the variables in the data. b. Prove that A.M>G. M>H.M (For both the variables). c. Estimate the values of Q1, D7 and P49 and Interpret the results. d. Compare Relative Dispersions of X and Y, Using (i) Quartile Coefficient of Dispersion and (ii) Coefcient of Variation. e. Explain whether the above two measures in part (d) provide the same information. f. Which Variable is more consistent. g. Discuss the shape of the variables X and Y using results of Mean. Median and Mode. h. Obtain mby Karl Pearson's formula, For which variable (X,Y) W is more sharp. i. Obtain the mWscoefficient of skews. Is there any change in the decision regarding the shape of the variables? j. Draw a scatter plot of the data. k. Obtain Pearson's coefcient of Correlation and interpret the results. 1. Discuss What changes will there be on the value of the correlation coefcient if we transform variables X (first variable in the data) and Y (second variable in the data) using the following expressions. will there be any change in the value of w, if so then why or if not then why, please discuss. u: 5x+46 and v=3y+2 Data Set: Diamond Prices Data of 20 round-cut diamonds along with their prices are taken from a newspaper X= Weight of diamonds in carat Y = Price in Singapore dollars X 0.3 0.3 0.3 0.3 0.31 0.31 0.31 0.31 0.31 0.31 0.32 0.32 0.33 033 0.34 0.34 0.34 0.34 0.34 0.34 Y 1302 1510 1510 1260 1641 1555 1427 1427 1126 1126 1468 1202 1327 1098 1693 1551 1410 1269 1316 1222 Source: httpsz//WW\\V2.stetson.edu/~jrasg/datahtm Journal of Statistics Education online data archive
Step by Step Solution
There are 3 Steps involved in it

Get step-by-step solutions from verified subject matter experts