

Question: = Applying Excel - Data Tables: Exercise (Part 2 of 2) On the Data Tables - Student tab in your Excel spreadsheet, update the given
 =
=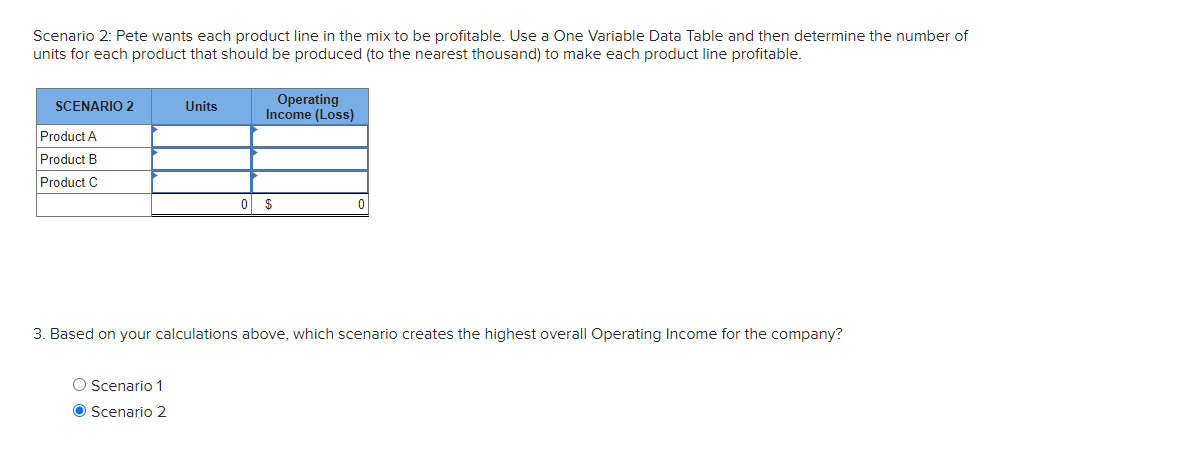
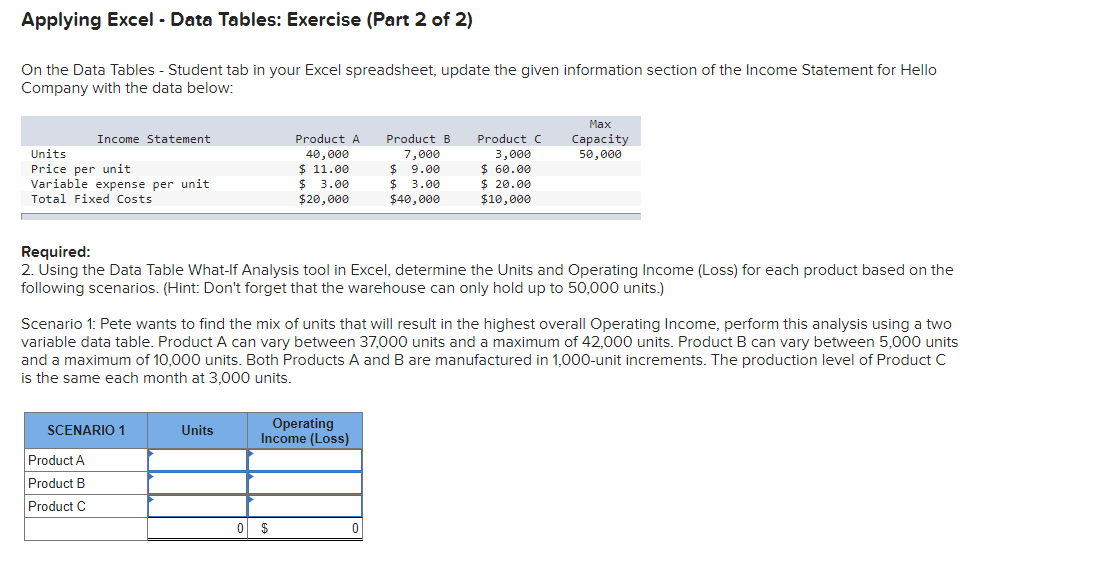
Applying Excel - Data Tables: Exercise (Part 2 of 2) On the Data Tables - Student tab in your Excel spreadsheet, update the given information section of the Income Statement for Hello Company with the data below: Required: 2. Using the Data Table What-If Analysis tool in Excel, determine the Units and Operating Income (Loss) for each product based on the following scenarios. (Hint: Don't forget that the warehouse can only hold up to 50,000 units.) Scenario 1: Pete wants to find the mix of units that will result in the highest overall Operating Income, perform this analysis using a two variable data table. Product A can vary between 37,000 units and a maximum of 42,000 units. Product B can vary between 5,000 units and a maximum of 10,000 units. Both Products A and B are manufactured in 1,000-unit increments. The production level of Product C is the same each month at 3,000 units. Scenario 2: Pete wants each product line in the mix to be profitable. Use a One Variable Data Table and then determine the number of units for each product that should be produced (to the nearest thousand) to make each product line profitable. 3. Based on your calculations above, which scenario creates the highest overall Operating Income for the company? Scenario 1 Scenario 2
Step by Step Solution
There are 3 Steps involved in it

Get step-by-step solutions from verified subject matter experts