

Question: Applying Excel - Data Visualization: Exercise (Part 2 of 2) On the Data Visualization - Student tab in your Excel spreadsheet, update the price per
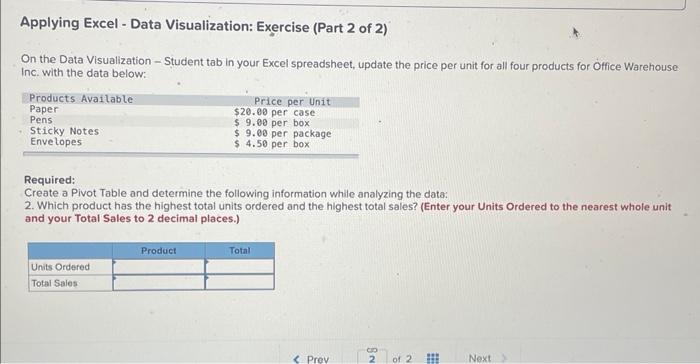
Applying Excel - Data Visualization: Exercise (Part 2 of 2) On the Data Visualization - Student tab in your Excel spreadsheet, update the price per unit for all four products for Office Warehouse Inc. with the data below: Required: Create a Pivot Table and determine the following information while analyzing the data: 2. Which product has the highest total units ordered and the highest total sales? (Enter your Units Ordered to the nearest whole unit and your Total Sales to 2 decimal places.) Applying Excel - Data Visualization: Exercise (Part 2 of 2) On the Data Visualization - Student tab in your Excel spreadsheet, update the price per unit for all four products for Office Warehouse Inc. with the data below: Required: Create a Pivot Table and determine the following information while analyzing the data: 2. Which product has the highest total units ordered and the highest total sales? (Enter your Units Ordered to the nearest whole unit and your Total Sales to 2 decimal places.)
Step by Step Solution
There are 3 Steps involved in it

Get step-by-step solutions from verified subject matter experts