

Question: Approximately what expected future long-run growth rate would provide the same EBITDA multiple in 2010 as Ideko has in 2005 (i.e., 9.1x)? Assume that the
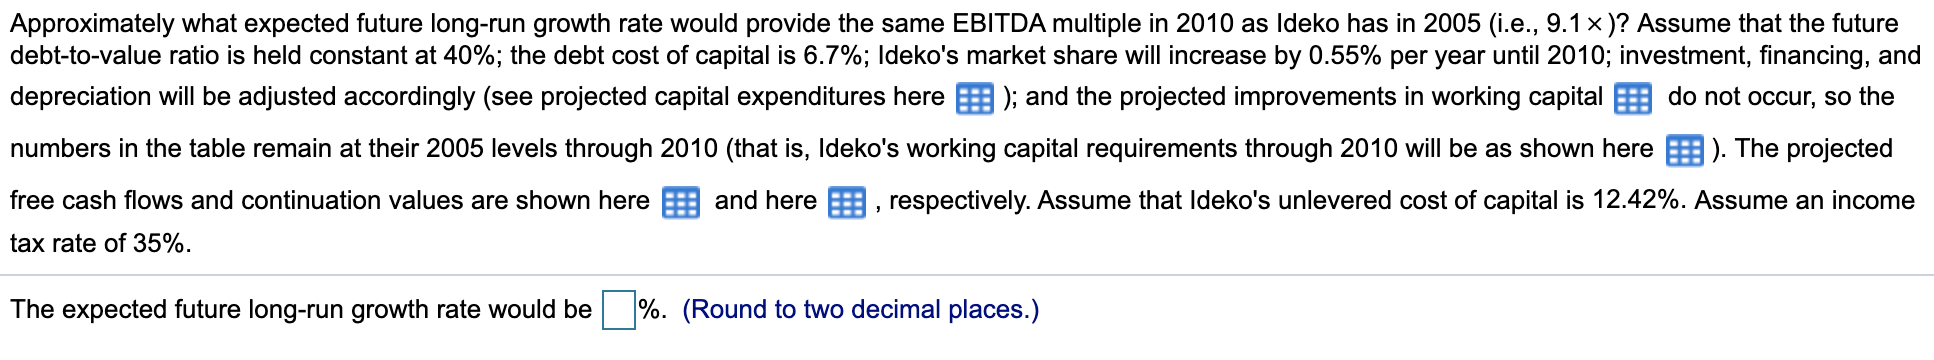
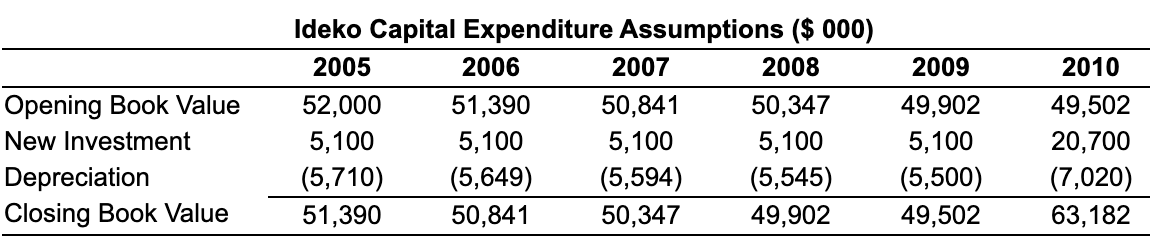
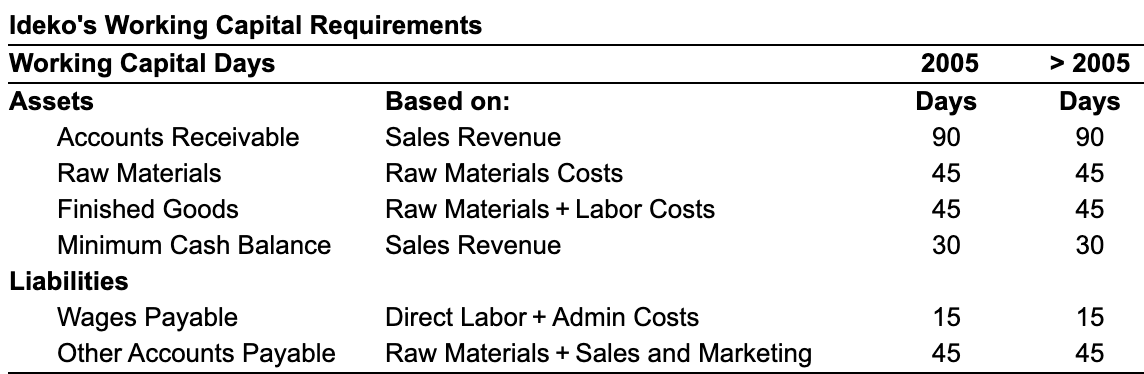
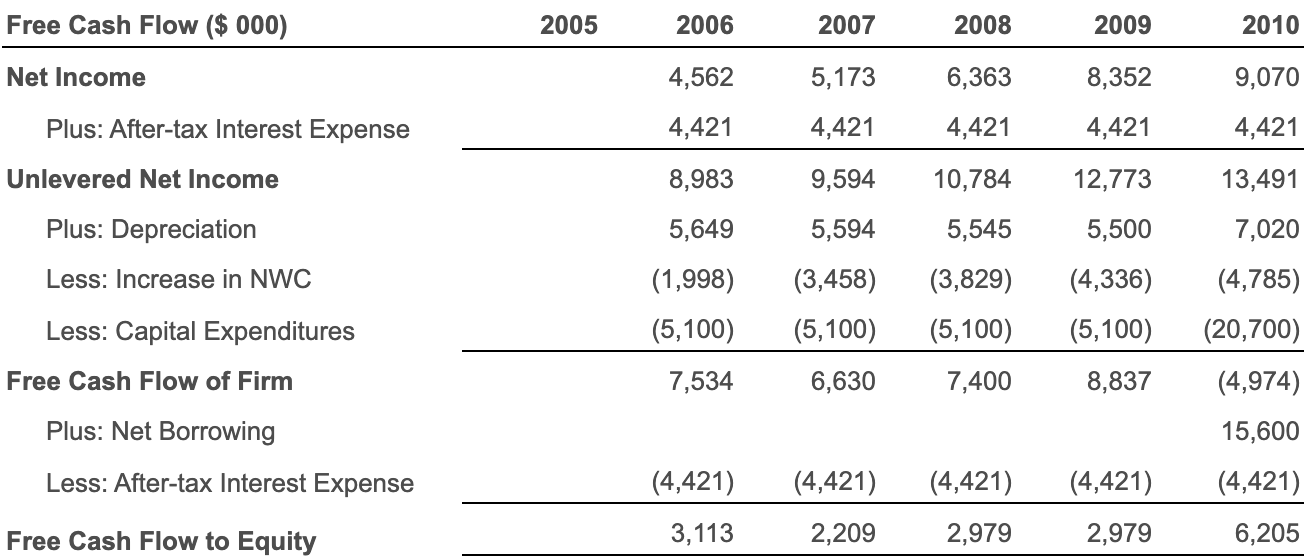
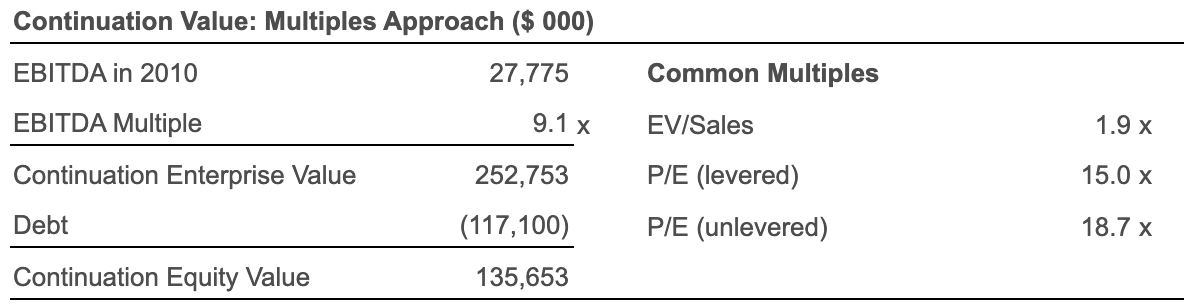
Approximately what expected future long-run growth rate would provide the same EBITDA multiple in 2010 as Ideko has in 2005 (i.e., 9.1x)? Assume that the future debt-to-value ratio is held constant at 40%; the debt cost of capital is 6.7%; Ideko's market share will increase by 0.55% per year until 2010; investment, financing, and depreciation will be adjusted accordingly (see projected capital expenditures here ); and the projected improvements in working capital do not occur, so the numbers in the table remain at their 2005 levels through 2010 (that is, Ideko's working capital requirements through 2010 will be as shown here 3 ). The projected free cash flows and continuation values are shown here and here , respectively. Assume that Ideko's unlevered cost of capital is 12.42%. Assume an income tax rate of 35%. The expected future long-run growth rate would be %. (Round to two decimal places.) 2009 2010 Opening Book Value New Investment Depreciation Closing Book Value Ideko Capital Expenditure Assumptions ($ 000) 2005 2006 2007 2008 52,000 51,390 50,841 50,347 5,100 5,100 5,100 5,100 (5,710) (5,649) (5,594) (5,545) 51,390 50,841 50,347 49,902 49,902 5,100 (5,500) 49,502 49,502 20,700 (7,020) 63,182 2005 Ideko's Working Capital Requirements Working Capital Days Assets Based on: Accounts Receivable Sales Revenue Raw Materials Raw Materials Costs Finished Goods Raw Materials + Labor Costs Minimum Cash Balance Sales Revenue Liabilities Wages Payable Direct Labor + Admin Costs Other Accounts Payable Raw Materials + Sales and Marketing Days 90 45 45 30 > 2005 Days 90 45 45 30 15 15 45 45 Working Capital ($ 000) 2005 2006 2007 2008 2009 2010 Assets Accounts Receivable 18,863 20,371 22,933 25,753 28,854 32,261 Raw Materials 2,071 2,125 2,365 2,626 2,909 3,216 Finished Goods 4,303 4,598 5,203 5,874 6,617 7,441 Minimum Cash Balance 6,288 6,790 7,644 8,584 9,618 10,754 Total Current Assets 31,525 33,884 38,145 42,837 47,998 53,672 Labilities 1,299 1,328 1,513 1,676 1,853 2,098 Wages Payable Other Accounts Payable 3,469 3,801 4,419 5,119 5,767 6,411 Total Current Liabilities 4,768 5,129 5,932 6,795 7,620 8,509 Net Working Capital 26,757 28,755 32,213 36,042 40,378 45,163 Increase in Net Working Capital 1,998 3,458 3,829 4,336 4,785 Free Cash Flow ($ 000) 2005 2006 2007 2008 2009 2010 Net Income 4,562 5,173 6,363 8,352 9,070 Plus: After-tax Interest Expense 4,421 4,421 4,421 4,421 4,421 Unlevered Net Income 8,983 9,594 10,784 12,773 13,491 Plus: Depreciation 5,649 5,594 5,545 5,500 7,020 Less: Increase in NWC (1,998) (5,100) (3,458) (5,100) (3,829) (5,100) (4,336) (5,100) (4,785) (20,700) Less: Capital Expenditures Free Cash Flow of Firm 7,534 6,630 7,400 8,837 (4,974) 15,600 Plus: Net Borrowing Less: After-tax Interest Expense (4,421) (4,421) (4,421) (4,421) (4,421) Free Cash Flow to Equity 3,113 2,209 2,979 2,979 6,205 Continuation Value: Multiples Approach ($ 000) EBITDA in 2010 27,775 Common Multiples EBITDA Multiple 9.1 x EV/Sales 1.9 x Continuation Enterprise Value 15.0 x 252,753 (117,100) P/E (levered) P/E (unlevered) Debt 18.7 x Continuation Equity Value 135,653
Step by Step Solution
There are 3 Steps involved in it

Get step-by-step solutions from verified subject matter experts