

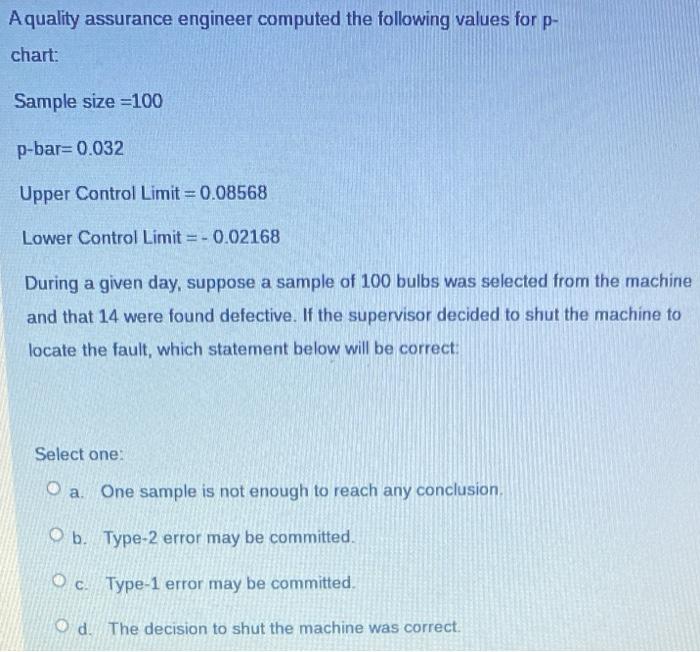
Question: Aquality assurance engineer computed the following values for p- chart: Sample size=100 p-bar=0.032 Upper Control Limit = 0.08568 Lower Control Limit = -0.02168 During a
Step by Step Solution
There are 3 Steps involved in it
1 Expert Approved Answer
Step: 1 Unlock

Question Has Been Solved by an Expert!
Get step-by-step solutions from verified subject matter experts
Step: 2 Unlock
Step: 3 Unlock