

Question: ard.com Saved Problem 13-1A Calculating and analyzing trend percents LO P1 Selected comparative financial statements of Haroun Company follow. ($ thousands) Sales Cost of goods
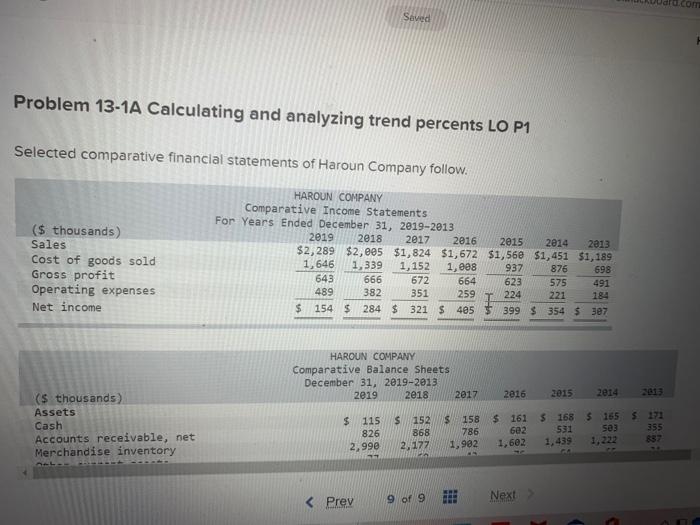
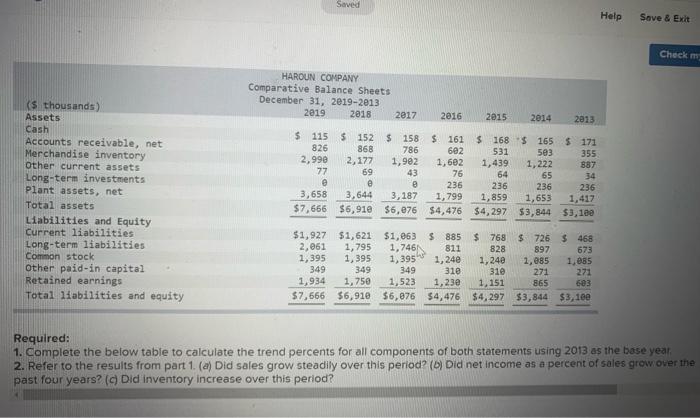
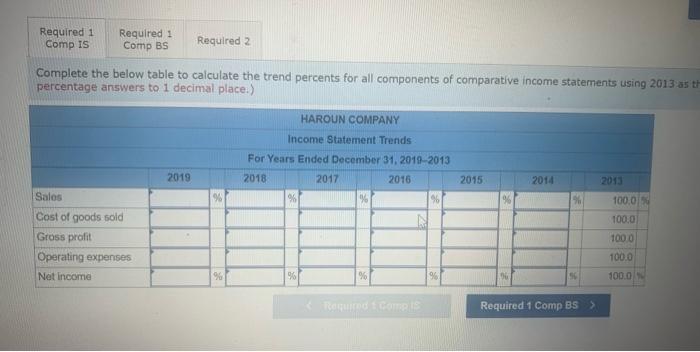
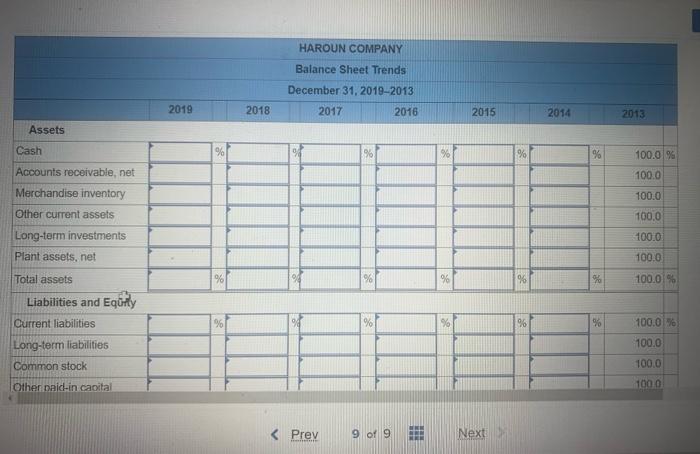
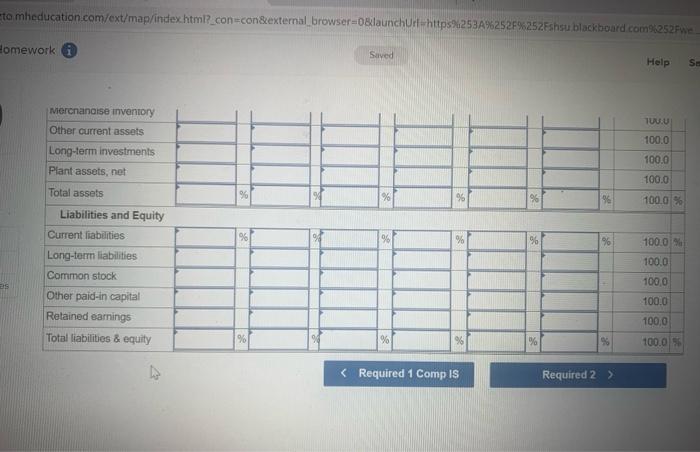
ard.com Saved Problem 13-1A Calculating and analyzing trend percents LO P1 Selected comparative financial statements of Haroun Company follow. ($ thousands) Sales Cost of goods sold Gross profit Operating expenses Net income HAROUN COMPANY Comparative Income Statements For Years Ended December 31, 2019-2013 2019 2018 2017 2016 2015 2014 2013 $2,289 $2,695 $1,824 $1,672 $1,568 $1,451 $1,189 1,646 1,339 1,152 1,888 937 876 698 643 666 672 664 623 575 491 489 382 351 259 224 221 184 $ 154 $ 284 $ 321 $ 405 $ 399 $ 354 $ 307 HAROUN COMPANY Comparative Balance Sheets December 31, 2019-2013 2019 2018 2017 2816 2015 2014 2013 ($ thousands) Assets Cash Accounts receivable, net Merchandise inventory $ 115 826 2,990 S 152 868 2,177 $ 158 786 1,982 $ 161 602 1,602 $ 1685 165 531 se 3 1,439 1,222 $ 171 355 897 Prev 9 of 9 Next Saved Help Save & Exit Check (s thousands) Assets Cash Accounts receivable, net Merchandise inventory Other current assets Long-term investments plant assets, net Total assets Liabilities and Equity Current liabilities Long-term liabilities Common stock Other paid-in capital Retained earnings Total liabilities and equity HAROUN COMPANY Comparative Balance Sheets December 31, 2019-2013 2019 2018 2017 2016 2015 2014 2013 $ 115 $ 152 S 158 $ 161 $ 168 $165 $ 171 826 868 786 602 531 5e3 355 2,990 2,177 1,992 1,602 1,439 1,222 887 77 69 43 76 64 65 34 e e 236 236 236 236 3,658 3,644 3,187 1,799 1,859 1,653 1,417 $7,656 $6,919 $6,076 $4,476 $4,297 $3,844 53,100 $1,927 $1,621 $1,063 S885 $ 768 $ 726 $ 468 2,061 1,795 1,7461 811 828 897 673 1,395 1,395 1,395 1,24e 1,240 1,085 1,085 349 349 349 310 310 271 271 1,934 1,750 1,523 1,230 1.151 865 603 $7,666 $6,910 $6,076 $4,476 $4,297 $3,844 $3,100 Required: 1. Complete the below table to calculate the trend percents for all components of both statements using 2013 as the base year 2. Refer to the results from part 1. (a) Did sales grow steadily over this period? (0) Did net income as a percent of sales grow over the past four years? (c) Did Inventory increase over this period? Required 1 Comp IS Required: Comp BS Required 2 Complete the below table to calculate the trend percents for all components of comparative income statements using 2013 ast percentage answers to 1 decimal place.) HAROUN COMPANY Income Statement Trends For Years Ended December 31, 2019-2013 2018 2017 2016 % % % 2019 2015 2014 2013 1000 Sales Cost of goods sold Gross profit Operating expenses Net Income 100,0 1000 100.0 9 96 96 100.0 RONOLORE Required 1 Comp BS > HAROUN COMPANY Balance Sheet Trends December 31, 2019-2013 2017 2016 2019 2018 2015 2014 2013 Assets Cash % 9 % % 100.0 % 100.0 Accounts receivable, net Merchandise inventory Other current assets Long-term investments Plant assets, net 100.0 100.0 100.0 100.0 Total assets % % 100.01% % % % 96 100.0% Liabilities and Equity Current liabilities Long-term liabilities Common stock Other paid-in capital 100.0 100.0 1000
Step by Step Solution
There are 3 Steps involved in it

Get step-by-step solutions from verified subject matter experts