

Question: Problem 13-1A Calculating and analyzing trend percents LO P1 Selected comparative financial statements of Haroun Company follow. ($ thousands) Sales Cost of goods sold Gross
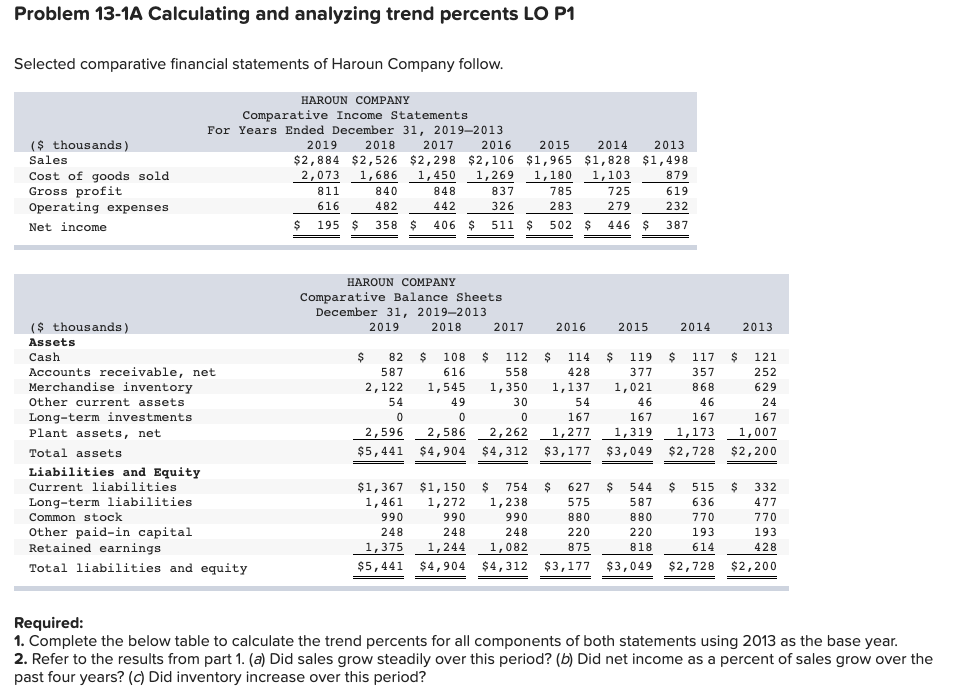
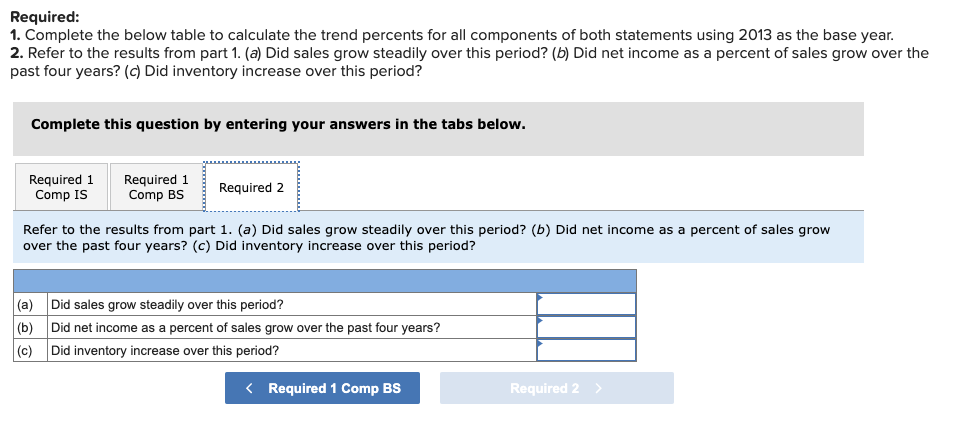
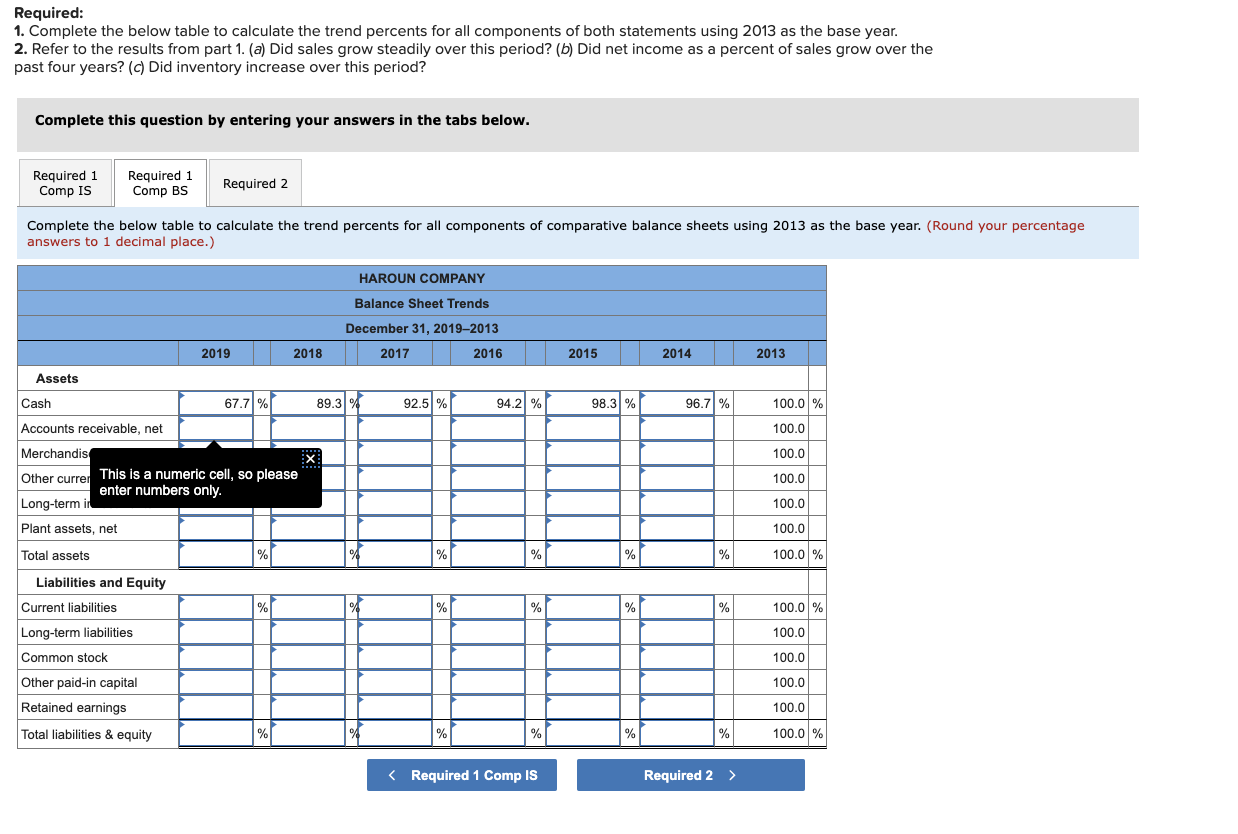
Problem 13-1A Calculating and analyzing trend percents LO P1 Selected comparative financial statements of Haroun Company follow. ($ thousands) Sales Cost of goods sold Gross profit Operating expenses Net income HAROUN COMPANY Comparative Income Statements For Years Ended December 31, 20192013 2019 2018 2017 2016 2015 2014 2013 $2,884 $2,526 $2,298 $2,106 $1,965 $1,828 $1,498 2,073 1,686 1,450 1,269 1,180 1,103 879 811 840 848 837 785 725 619 616 482 442 326 283 279 232 $ 195 $ 358 $ 406 $ 511 $ 502 $ 446 $ 387 HAROUN COMPANY Comparative Balance Sheets December 31, 2019-2013 2019 2018 2017 2016 2015 2014 2013 ($ thousands) Assets Cash Accounts receivable, net Merchandise inventory Other current assets Long-term investments Plant assets, net Total assets Liabilities and Equity Current liabilities Long-term liabilities Common stock Other paid-in capital Retained earnings Total liabilities and equity $ 82 $ 108 $ 112 587 616 558 2,122 1,545 1,350 54 49 30 0 0 0 0 2,596 2,586 2,262 $5,441 $4,904 $4,312 $ $ 114 $ 119 $ 117 $ 121 428 377 357 252 1,137 1,021 868 629 54 46 46 24 167 167 167 167 1,277 1,319 1,173 1,007 $3,177 $3,049 $2,728 $2,200 $1,367 $1,150 $ 754 $ 627 $ 544 $ 515 $ 332 1,461 1,272 1,238 575 587 636 477 990 990 990 880 880 770 770 248 248 248 220 220 193 193 1,375 1, 244 1,082 875 818 614 428 $5,441 $4,904 $4,312 $3,177 $3,049 $2,728 $2,200 Required: 1. Complete the below table to calculate the trend percents for all components of both statements using 2013 as the base year. 2. Refer to the results from part 1. (a) Did sales grow steadily over this period? (b) Did net income as a percent of sales grow over the past four years? (c) Did inventory increase over this period? Required: 1. Complete the below table to calculate the trend percents for all components of both statements using 2013 as the base year. 2. Refer to the results from part 1. (a) Did sales grow steadily over this period? (6) Did net income as a percent of sales grow over the past four years? (c) Did inventory increase over this period? Complete this question by entering your answers in the tabs below. Required 1 Comp IS Required 1 Comp BS Required 2 Refer to the results from part 1. (a) Did sales grow steadily over this period? (b) Did net income as a percent of sales grow over the past four years? (c) Did inventory increase over this period? (a) Did sales grow steadily over this period? (b) Did net income as a percent of sales grow over the past four years? (c) Did inventory increase over this period? Required: 1. Complete the below table to calculate the trend percents for all components of both statements using 2013 as the base year. 2. Refer to the results from part 1. (a) Did sales grow steadily over this period? (b) Did net income as a percent of sales grow over the past four years? (c) Did inventory increase over this period? Complete this question by entering your answers in the tabs below. Required 1 Comp IS Required 1 Comp BS Required 2 Complete the below table to calculate the trend percents for all components of comparative balance sheets using 2013 as the base year. (Round your percentage answers to 1 decimal place.) HAROUN COMPANY Balance Sheet Trends December 31, 2019-2013 2019 2018 2017 2016 2015 2014 2013 89.31% 92.5% 94.2 % 98.3 % 96.7% 100.0 % 100.0 Assets Cash 67.7% Accounts receivable, net Merchandis Other currer This is a numeric cell, so please enter numbers only. Long-term i X 100.0 100.0 100.0 Plant assets, net 100.0 Total assets % % % % % 100.0 % Liabilities and Equity Current liabilities % % % % % 100.0 % 100.0 Long-term liabilities Common stock 100.0 100.0 Other paid-in capital Retained earnings 100.0 Total liabilities & equity % % % % % 100.0 %
Step by Step Solution
There are 3 Steps involved in it

Get step-by-step solutions from verified subject matter experts