

Question: Are the two cash flows shown in the table below equivalent? Use an interest rate of 10%. Draw a proper cash flow diagram for each
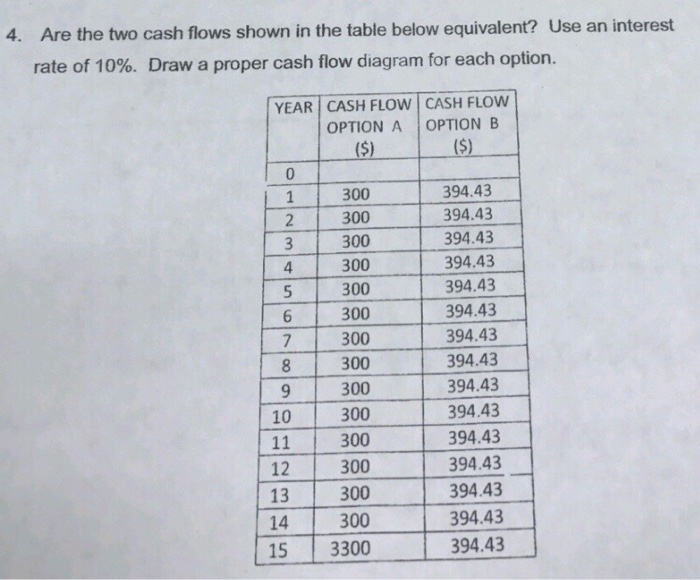
Are the two cash flows shown in the table below equivalent? Use an interest rate of 10%. Draw a proper cash flow diagram for each option. 4. YEAR CASH FLOW CASH FLOW OPTION A OPTIONB 0 300 300 300 300 300 300 300 300 300 394.43 394.43 394.43 394.43 394.43 394.43 394.43 394.43 394.43 394.43 4 1000394.43 12 13 14 394.43 394.43 300 300 594.12 15 3300394.43
Step by Step Solution
There are 3 Steps involved in it
1 Expert Approved Answer
Step: 1 Unlock

Question Has Been Solved by an Expert!
Get step-by-step solutions from verified subject matter experts
Step: 2 Unlock
Step: 3 Unlock