

Question: Are you able to explain this box plot ........... ......... O Search application Output Frequencies Case Processing Summary Title Notes Cases Active Dataset Valid Missing
Are you able to explain this box plot

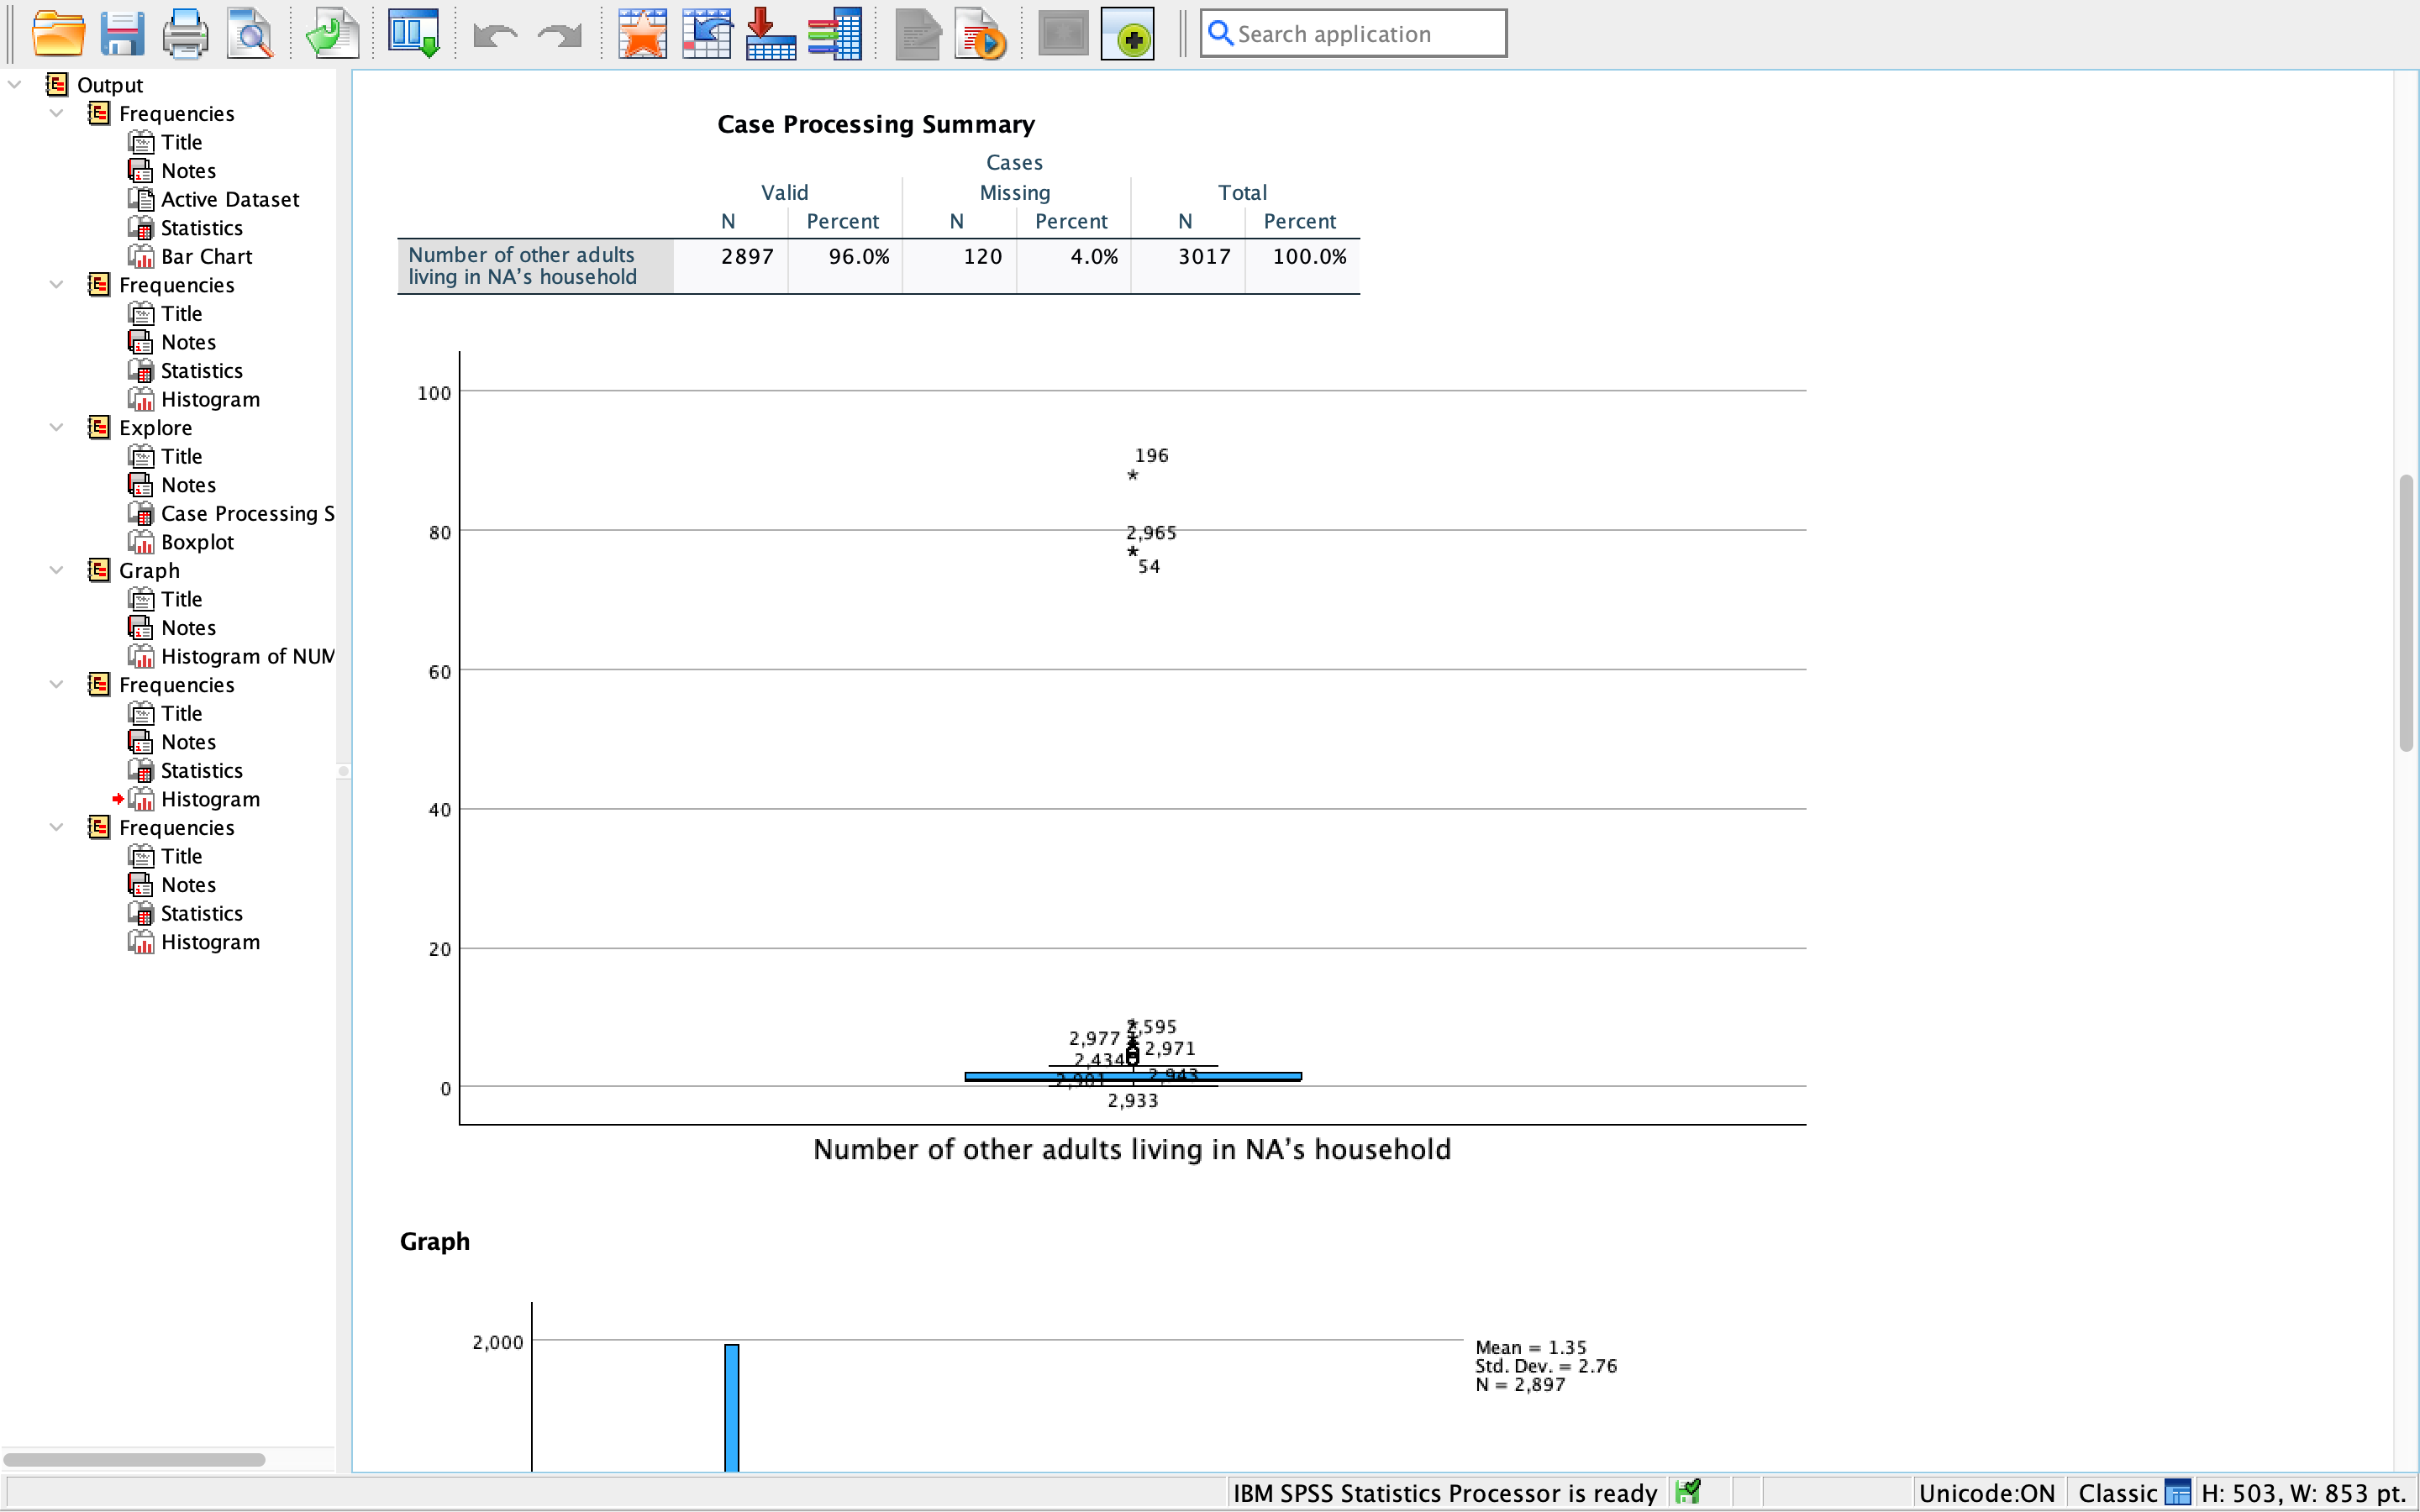
........... ......... O Search application Output Frequencies Case Processing Summary Title Notes Cases Active Dataset Valid Missing Total Statistics N Percent V Percent V Percent Bar Chart Number of other adults 2897 96.0% 120 4.0% 3017 100.0% Frequencies living in NA's household Title Notes Statistics [ Histogram 100 Explore Title 196 * Notes Case Processing S Boxplot 80 2,965 Graph * 54 Title Notes L Histogram of NUM 60 Frequencies Title Notes Statistics * Histogram 40 Frequencies Title LE Notes Statistics I Histogram 20 4,595 38 2,971 2,933 Number of other adults living in NA's household Graph 2,000 Mean = 1.35 Std. Dev. = 2.76 N = 2,897 IBM SPSS Statistics Processor is ready . Unicode:ON |Classic |H: 503, W: 853 pt............ ......... O Search application Output Frequencies Case Processing Summary Title Notes Cases Active Dataset Valid Missing Total Statistics N Percent V Percent V Percent Bar Chart Number of other adults 2897 96.0% 120 4.0% 3017 100.0% Frequencies living in NA's household Title Notes Statistics [ Histogram 100 Explore Title 196 * Notes Case Processing S Boxplot 80 2,965 Graph * 54 Title Notes L Histogram of NUM 60 Frequencies Title Notes Statistics * Histogram 40 Frequencies Title LE Notes Statistics I Histogram 20 4,595 38 2,971 2,933 Number of other adults living in NA's household Graph 2,000 Mean = 1.35 Std. Dev. = 2.76 N = 2,897 IBM SPSS Statistics Processor is ready . Unicode:ON |Classic |H: 503, W: 853 pt
Step by Step Solution
There are 3 Steps involved in it

Get step-by-step solutions from verified subject matter experts