

Question: Are you able to explain this histogram? ........... + Search application ......... Output Frequencies Title Frequencies Notes Active Dataset Statistics Statistics Bar Chart Number of
Are you able to explain this histogram?
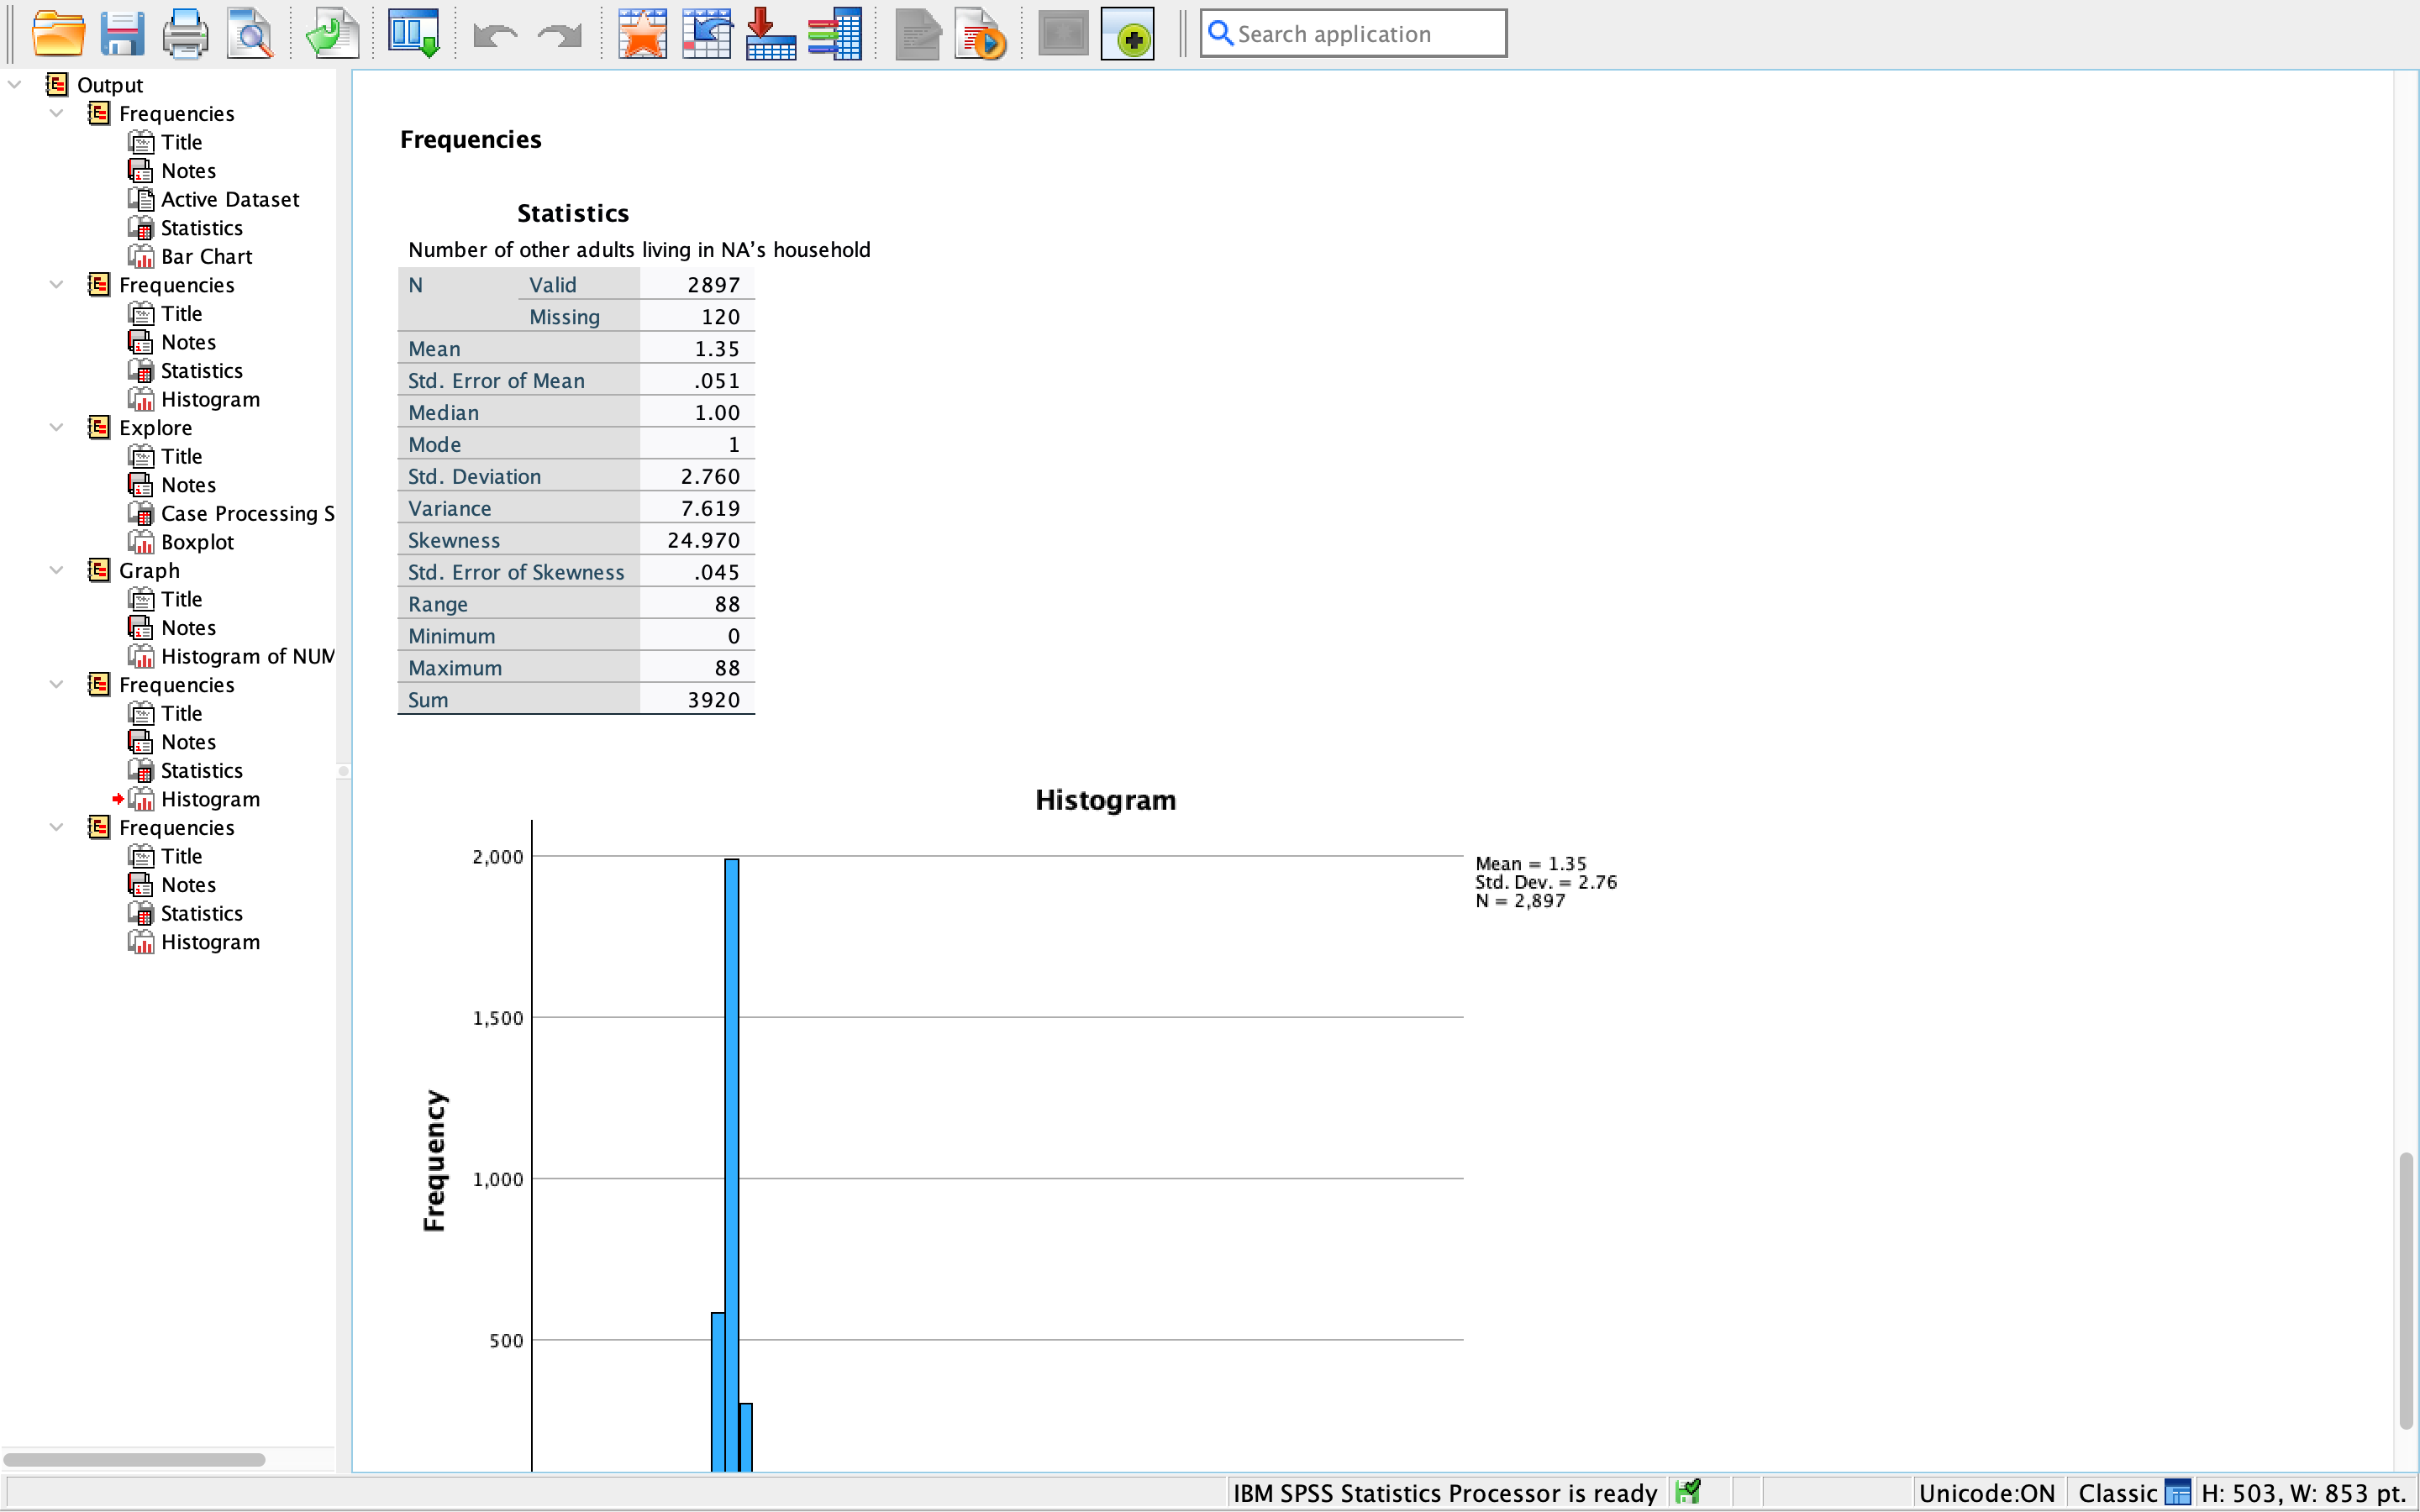
........... + Search application ......... Output Frequencies Title Frequencies Notes Active Dataset Statistics Statistics Bar Chart Number of other adults living in NA's household Frequencies N Valid 2897 Title Missing 120 Notes Mean 1.35 Statistics Std. Error of Mean .051 [ Histogram Median 1.00 Explore Mode Title 2.760 Notes Std. Deviation Case Processing S Variance 7.619 Boxplot Skewness 24.970 Graph Std. Error of Skewness .045 Title Range 88 Notes Minimum L Histogram of NUM Maximum 88 Frequencies Sum 3920 Title Notes Statistics * Histogram Histogram Frequencies Title 2,000 Mean = 1.35 Std. Dev. = 2.76 LE Notes N = 2,897 Statistics I Histogram 1,500 Frequency 1,000 500 IBM SPSS Statistics Processor is ready Unicode:ON |Classic | H: 503, W: 853 pt
Step by Step Solution
There are 3 Steps involved in it

Get step-by-step solutions from verified subject matter experts