

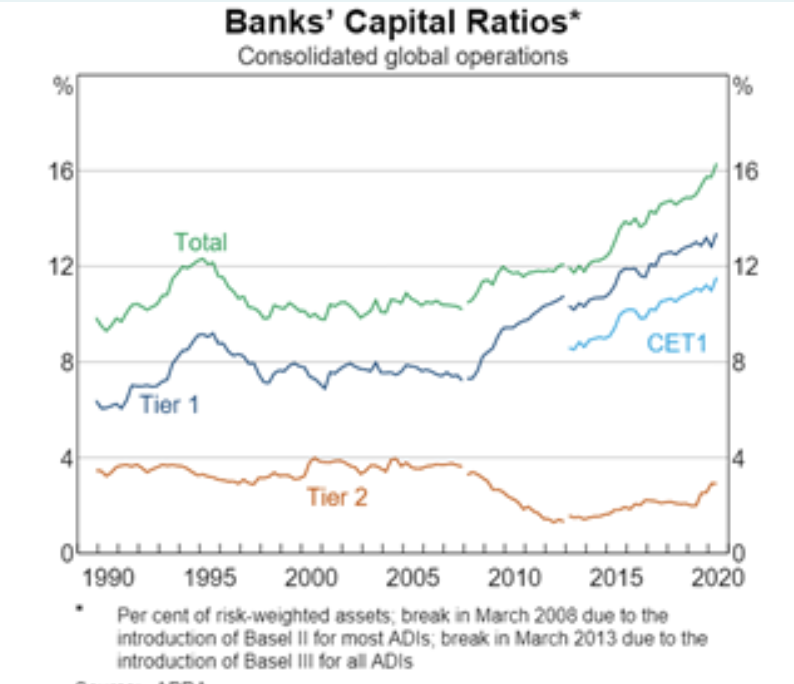
Question: A.Refer to the following graph and comment on the changes in Australian banks capital position from the 2008 Global Financial Crisis to 2020. Provide reasons
A.Refer to the following graph and comment on the changes in Australian banks capital position from the 2008 Global Financial Crisis to 2020. Provide reasons as to why these changes have occurred across different layers of capital.
B.Explain two (2) ways a bank can overcome a capital excess. Detail the pros and cons of each approach.
C.Data for Menzies Bank is given below.
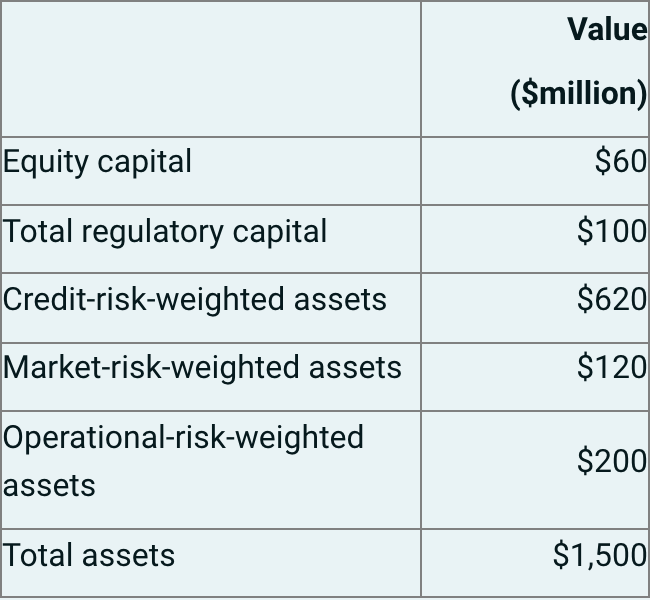
(i) Calculate Menzies Banks risk-based capital ratios for Common Equity Tier 1 and total regulatory capital (show all workings).
(ii) Assess whether Menzies Bank has met the Basel III minimum requirements (including the capital conservation buffer) for each of the two (2) capital ratios calculated in part (i).
Banks' Capital Ratios* Consolidated global operations % 1% 16 16 Total 12 12 CET1 8 8 Tier 1 4 Tier 2 1990 1995 2000 2005 2010 2015 2020 Per cent of risk-weighted assets, break in March 2008 due to the introduction of Basel Il for most ADls, break in March 2013 due to the introduction of Basel III for al ADIS Value ($million) Equity capital $60 Total regulatory capital $100 Credit-risk-weighted assets $620 Market-risk-weighted assets $120 Operational-risk-weighted assets $200 Total assets $1,500 Banks' Capital Ratios* Consolidated global operations % 1% 16 16 Total 12 12 CET1 8 8 Tier 1 4 Tier 2 1990 1995 2000 2005 2010 2015 2020 Per cent of risk-weighted assets, break in March 2008 due to the introduction of Basel Il for most ADls, break in March 2013 due to the introduction of Basel III for al ADIS Value ($million) Equity capital $60 Total regulatory capital $100 Credit-risk-weighted assets $620 Market-risk-weighted assets $120 Operational-risk-weighted assets $200 Total assets $1,500
Step by Step Solution
There are 3 Steps involved in it

Get step-by-step solutions from verified subject matter experts