

Question: Armidale Manufacturing Company: Analysis of Financial Statements In July 2020, David Coventry, owner of the Armidale Manufacturing Company (AMC), approached the local bank for additional
Armidale Manufacturing Company: Analysis of Financial Statements
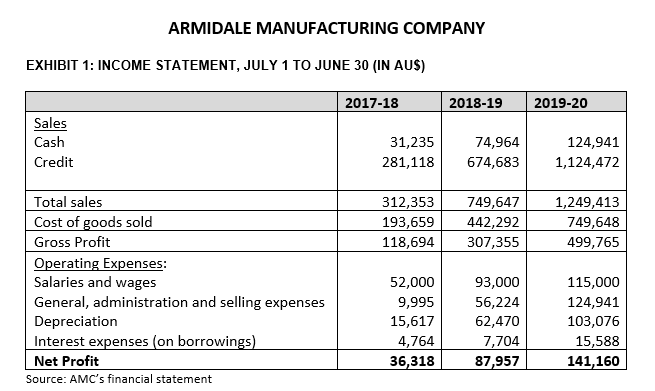
In July 2020, David Coventry, owner of the Armidale Manufacturing Company (AMC), approached the local bank for additional funding of 1 million dollars to meet the growing requirements of his garment manufacturing company. After an increase in revenue from $312,353 to $1,249,413 in three years and a phenomenal increase in net profit from $36,318 to $141,160 during the same period, David confidently discussed the financial needs of his company.
In a lengthy and healthy discussion with the bank manager, David explained the development of his company and the dynamics and growth opportunities of the garment and textile market in Australia. David proudly presented the performance of his company to the bank manager, which he believed was excellent in a highly competitive industry environment. The bank manager handed over the financial records of AMC, including an income statement and balance sheet (see Exhibits 1 and 2 in file attached), to his loan officer and ensured David that once the documents were processed and analysed, he would get back to him in the coming week. He instructed the loan officer to process the loan application submitted by David as soon as possible and inform him about the decision taken by the bank.
Armidale Manufacturing Company
Established in 2017, David was in the business of garment manufacturing, specialising in formal wear for youths up to 12 years of age. David, a qualified textile engineer who had worked for almost 12 years in a local garment manufacturing company, had left his job to open this small manufacturing unit, together with some of the skilled labourers he had known for many years. He was aware that competition was stiff in the sector, as both small-scale units and large-scale manufacturing units were present.
David felt that there was a dearth of good-quality formal wear in the market. He was confident that if he provided innovative and modern garments to customers at reasonable prices, a sizeable share of the market still not penetrated by large companies could be captured. He was also aware that opportunities were growing in this segment.
David was familiar with the complete process of garment manufacturing, so he had no great difficulty starting the enterprise. With a capital of $185,000, he opened for business in July 2017 at his residential premises, half of which he had converted into a small factory. The installation of machines and the procurement of raw materials were not challenging tasks for him, and he was able to arrange for all the resources required for manufacturing without encountering any obstacles. The only problem he faced was getting a stylish designer who could help him in designing new, modern dress styles for children. He felt that his exposure to design was inadequate; therefore, he recruited Amy Spencer, a young fashion designer who had taken a course in fashion designing.
With the commitment of Amy, a team of dedicated skilled labourers, and the experience and expertise of David, the manufacturing unit suddenly started getting orders in numbers beyond its expectations. The fresh and new creative designs, good-quality fabrics, and fine finishing details spurred demand for the dresses, and the business started to grow.
Financial Situation of AMC
Financial liquidity and funding problems started increasing with the growth of the business. David began to face funding problems due to:
the working capital required for regular purchases of raw materials,
excessive credit periods granted to customers,
a shortage of funds for purchasing new machines required for manufacturing, and
insufficient factory space.
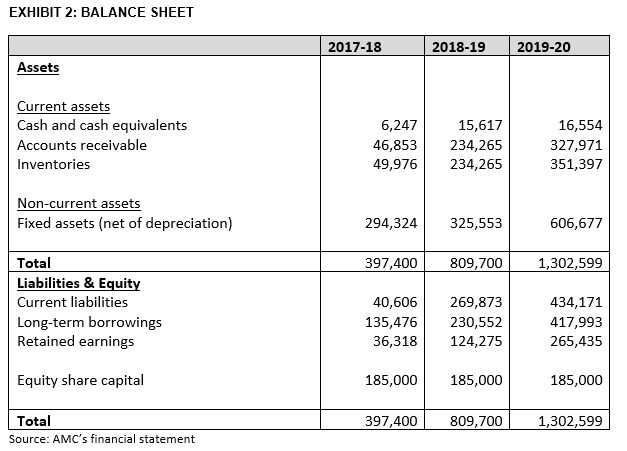
In 2017, when he started the business, David incorporated the company as a private limited company where he and his wife were the only shareholders; they had shares of $185,000. He borrowed funds during that year in the form of a mortgage loan and used the borrowed funds for both the short-term and long-term requirements of the business. The total amount borrowed by the company during 2017 was $135,476 (taken against the mortgage of his assets, which had a carrying amount of $294,324). As the business expanded in subsequent years and the asset requirements increased, he continued to borrow money from the bank. In the second year, the loan from the mortgage was $230,552; in the third year, it was $417,993. David had little difficulty in procuring the mortgage loan, as the mortgaged value of his assets was quite high, and he also provided collateral security (his residential house) to the bank. With a negative cash flow from operations during the first year, David experienced difficulties in making loan repayments. This situation improved a bit during the second year and significantly during the third year. Evidently, David was not particularly cognisant of the financial nuances of long-term or short-term loans, so he simply continued to withdraw money and to use the funds wherever the need was felt.
Proposal to the Bank: Current Scenario
David urgently needed the loan to meet the cash and investment requirements of the business. He submitted a detailed proposal and project report to the bank, along with the financial statements of previous years.
As the business expanded and the number of clients increased, his financial problems had also increased. Davids credibility in the market was good, so he had no problem procuring the necessary raw materials, but he faced a problem when trying to collect money from his customers because he had no structured system for keeping track of extensions of credit periods. He had also begun to observe stock piling up in his factory, as the orders were either not dispatched or the customers delayed delivery. His machines were also getting old, and he felt that the time had come to replace them with new ones that were modern and more efficient. The factory space was not sufficient, and a larger location was essential. New skilled labourers and some additional staff members were also required to support his expansion plans.
All in all, David faced a severe need for additional financing of 1 million dollars at a minimum to continue with smooth operations and to expand his business.
Eagerly awaiting the decision of the bank, which he was anticipating would be favourable, David sat in his office and envisaged taking AMC to new heights.
Assignment Question
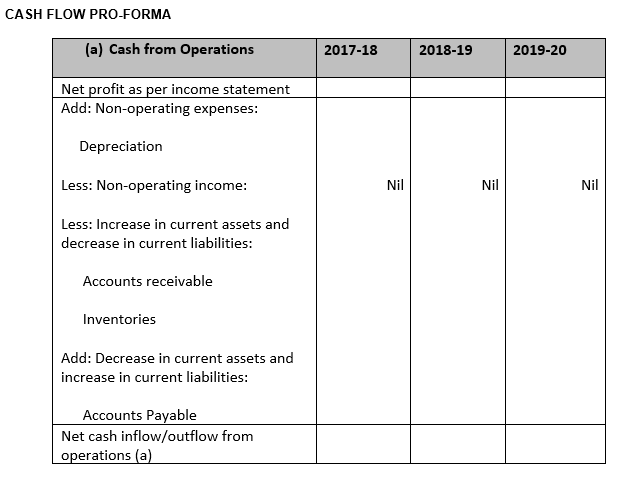
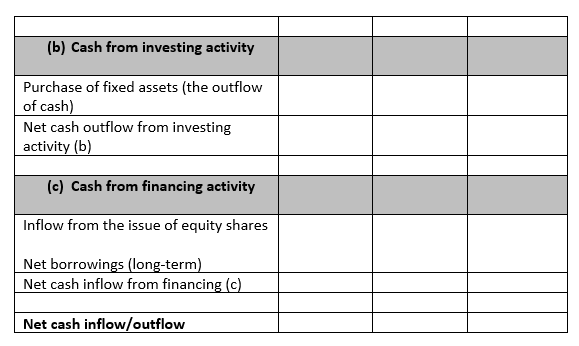
Q1. a)Complete the cash flow pro-forma (see attached file) for AMC and analyse it.
b)Perform vertical analysis on the balance sheet and comment on results.
c)Perform a trend analysis of AMCs income statement. Include a graph.
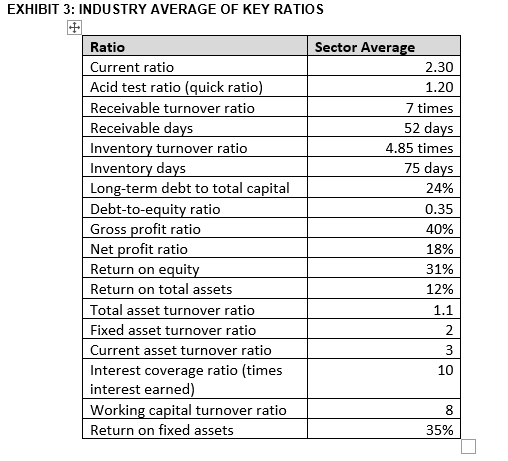
d)Compute the ratios for AMC and compare them with industry ratios (Exhibit 3).
e)Based on the comparison on question 4, would you, as the loan officer, grant the loan to David? Give reasoning.
f)What areas of improvement can you suggest for the future?
g)Comment on what potential environmental sustainability information may be of interest for external parties.
ARMIDALE MANUFACTURING COMPANY EXHIBIT 1: INCOME STATEMENT, JULY 1 TO JUNE 30 (IN AUS) 2017-18 2018-19 2019-20 Sales Cash Credit 31,235 281,118 74,964 674,683 124,941 1,124,472 312,353 193,659 118,694 749,647 442,292 307,355 1,249,413 749,648 499,765 Total sales Cost of goods sold Gross Profit Operating Expenses: Salaries and wages General, administration and selling expenses Depreciation Interest expenses (on borrowings) Net Profit Source: AMC's financial statement 52,000 9,995 15,617 4,764 36,318 93,000 56,224 62,470 7,704 87,957 115,000 124,941 103,076 15,588 141,160 EXHIBIT 2: BALANCE SHEET 2017-18 2018-19 2019-20 Assets Current assets Cash and cash equivalents Accounts receivable Inventories 6,247 46,853 49,976 15,617 234,265 234,265 16,554 327,971 351,397 Non-current assets Fixed assets (net of depreciation) 294,324 325,553 606,677 397,400 809,700 1,302,599 Total Liabilities & Equity Current liabilities Long-term borrowings Retained earnings 40,606 135,476 36,318 269,873 230,552 124,275 434,171 417,993 265,435 Equity share capital 185,000 185,000 185,000 Total Source: AMC's financial statement 397,400 809,700 1,302,599 EXHIBIT 3: INDUSTRY AVERAGE OF KEY RATIOS Ratio Current ratio Acid test ratio (quick ratio) Receivable turnover ratio Receivable days Inventory turnover ratio Inventory days Long-term debt to total capital Debt-to-equity ratio Gross profit ratio Net profit ratio Return on equity Return on total assets Total asset turnover ratio Fixed asset turnover ratio Current asset turnover ratio Interest coverage ratio (times interest earned) Working capital turnover ratio Return on fixed assets Sector Average 2.30 1.20 7 times 52 days 4.85 times 75 days 24% 0.35 40% 18% 31% 12% 1.1 2 3 10 8 35% CASH FLOW PRO-FORMA (a) Cash from Operations 2017-18 2018-19 2019-20 Net profit as per income statement Add: Non-operating expenses: Depreciation Less: Non-operating income: Nil Nil Nil Less: Increase in current assets and decrease in current liabilities: Accounts receivable Inventories Add: Decrease in current assets and increase in current liabilities: Accounts Payable Net cash inflow/outflow from operations (a) (b) Cash from investing activity Purchase of fixed assets (the outflow of cash) Net cash outflow from investing activity (b) (c) Cash from financing activity Inflow from the issue of equity shares Net borrowings (long-term) Net cash inflow from financing (c) Net cash inflow/outflow
Step by Step Solution
There are 3 Steps involved in it

Get step-by-step solutions from verified subject matter experts