

Question: around 800 words Question Completion Status: QUESTION 26 The tables below display some of the key financial ratios calculated for con Mobil Corp during the
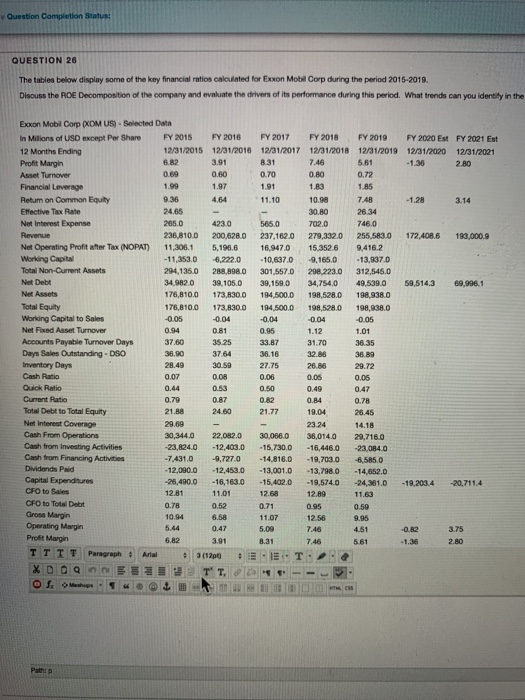
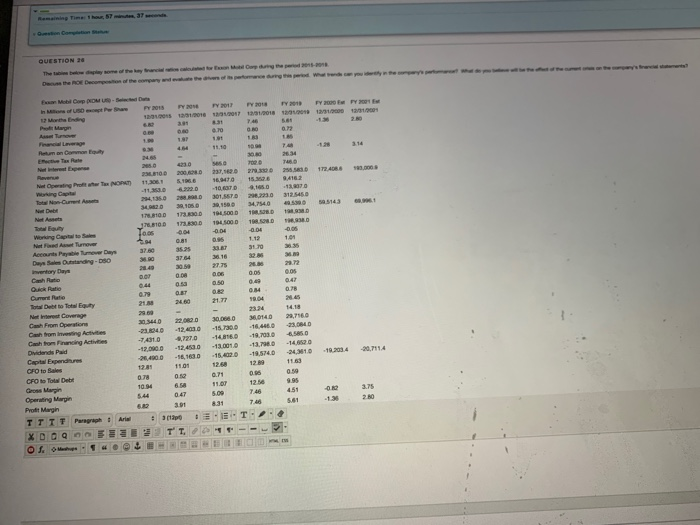
Question Completion Status: QUESTION 26 The tables below display some of the key financial ratios calculated for con Mobil Corp during the period 2015-2019 Discuss the ROE Decomposition of the company and evaluate the drivers of its performance during this period. What trends can you identity in the FY2020 E 12/31/2020 -1.38 FY 2021 E 12/31/2001 2.80 0.00 3.14 172.408.6 199,000.9 59,5143 60096.1 0.95 101 Boon Mobi Corp DOM US Selected Data Millions of USD except Per Share FY 2015 FY 2016 12 Months Ending 12/31/2015 12/31/2016 Profit Margin Asset Turnover 0.60 Financial Leverage 1.99 1.97 Retum on Common Equity 936 Effective Tax Rate 24.65 Net Interest Expense 2050 430 Revenue 236,810.0 200,628.0 Net Operating Profit after Tax (NOPAT) 11,306,1 5,196.6 Working Capital -11,353. 0 6 .222.0 Total Non-Ourrent Assets 294,1350 288,898.0 Net Debt 34. 920 39,105.0 Net Assets 176,810.0 173,830.0 Total Equity 176,810.0 173,830.0 Working Capital to Sales -0.05 -0.04 Net Fixed Asset Turnover 0.94 0.81 Accounts Payable Turnover Days 37.60 35.25 Days Sales Outstanding - DSO 30.90 3764 Inventory Days 28.49 30.59 Cash Ratio 0.07 0.08 Quick Ratio 0.53 Current Ratio 0.79 0.87 Total Debit to Total Equity 21.88 24.60 Net interest Coverage 29.69 Cash From Operations 30,344.0 22.082.0 Cash from Investing Activities -23,8240 -12.403,0 Cash from Financing Activities -7,431,0 -9.727.0 Didendis Paid -12.090.0 12.453.0 Capital Expenditures -26,490.0 -16,163.0 CFO to Sales 12.81 11.01 CFO to Total Debt 0.78 Gross Margin 10.94 6.58 Operating Margin 0.47 ProtMargin 3.91 TTTT Paragraph Ariel (120 FY 2017 FY 2018 FY 2019 12/31/2017 12/01/2018 12/31/2019 8.31 7.46 5.61 0.70 0.72 1.91 1.83 1.85 11.10 10.98 7.48 30.80 26.34 565.0 7020 746.0 237,162.0 279,332,0 255,583.0 16,947.0 15,352.6 9.416.2 -10,637.0 -9,165.0 -13,937.0 301.557.0 298.223.0 312,545.0 39,159.0 34,754.0 49,539.0 194 5000 198,5280 198.9380 194,500.0 198,528.0 198,938,0 -0.04 -0.04 0.05 1.12 33.87 31.70 36.35 30.16 32.86 36.89 26.86 29.72 0.06 0.06 0.05 0.50 0.49 0.47 0.R2 0.84 0.78 21.77 19.04 26.45 23 24 14.18 30,066.0 38,014.0 29.716.0 -15.730.0 -16,446.0 -23,084.0 -148160 -19,7030 6.585. - 13.001. 13.7980 -14,652.0 -15.4020 1 9.5740 -2431.0 12 58 12.89 0.95 0.59 12.56 9.96 5.09 745 4.51 5.51 - 27,75 -19.2004 20,711.4 0.71 3.75 QUESTION 20 7 . Return on o u Ne 4020301 ETD 23031214450 D D 194.000 100. 0 Days Outstanding - D50 vertory Days 2775 2 Current 21 20 1418 Cash to investing Activities -23040 -74010 -12.4030 4,7270 15. -14 18.3023. 00 19.703. 0 0 -14 Capa pandur CFO to fa CFO Det 1163 O Operating Margin Proft Margin TTTT PAST XDOG BRETT -- OSO
Step by Step Solution
There are 3 Steps involved in it

Get step-by-step solutions from verified subject matter experts