

Question: Save Answer QUESTION 26 40 points The tables below display some of the key financial ratios calculated for Alibaba Group Holding Ltd during the period
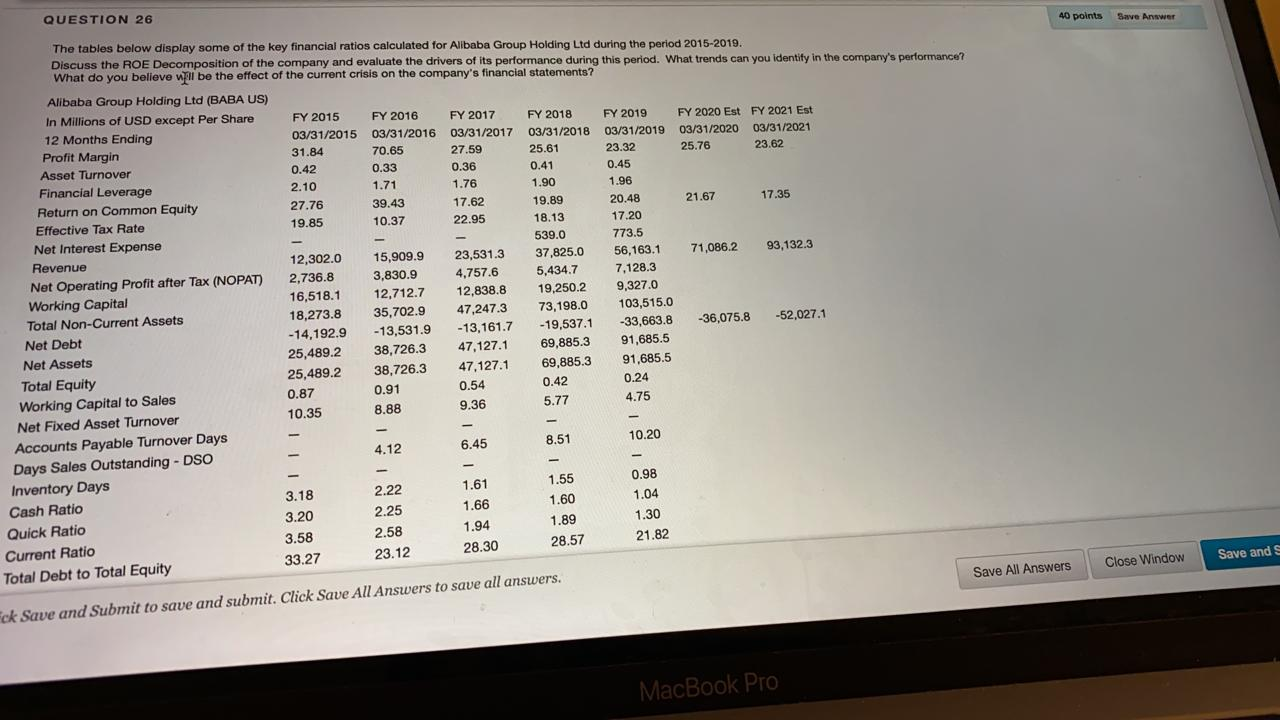
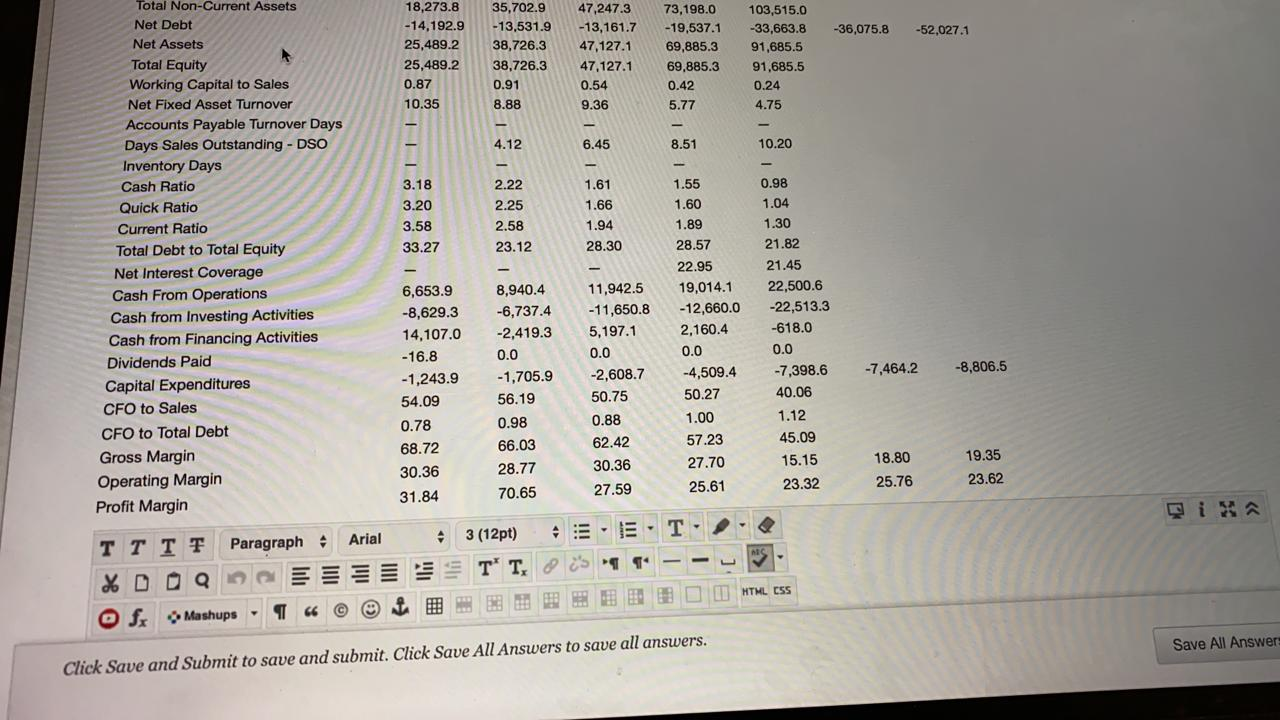
Save Answer QUESTION 26 40 points The tables below display some of the key financial ratios calculated for Alibaba Group Holding Ltd during the period 2015-2019. Discuss the ROE Decomposition of the company and evaluate the drivers of its performance during this period. What trends can you identity in the company's performance? What do you believe will be the effect of the current crisis on the company's financial statements? Alibaba Group Holding Ltd (BABA US) In Millions of USD except Per Share FY 2015 FY 2016 FY 2017 FY 2018 FY 2019 FY 2020 Est FY 2021 Est 12 Months Ending 03/31/2015 03/31/2016 03/31/2017 03/31/2018 03/31/2019 03/31/2020 03/31/2021 Profit Margin 31.84 70.65 27.59 25.61 23.32 25.76 23.62 Asset Turnover 0.42 0.33 0.36 0.41 0.45 Financial Leverage 2.10 1.71 1.76 1.90 1.96 27.76 39.43 19.89 17.62 20.48 Return on Common Equity 21.67 17.35 19.85 10.37 22.95 18.13 Effective Tax Rate 17.20 539.0 773.5 Net Interest Expense 15,909.9 23,531.3 12,302.0 37,825.0 71,086.2 56,163.1 93,132.3 Revenue 3,830.9 2,736.8 4,757.6 5,434.7 7,128.3 Net Operating Profit after Tax (NOPAT) 16,518.1 12,712.7 12,838.8 19,250.2 9,327.0 Working Capital 18,273.8 35,702.9 47,247.3 73,198.0 103,515.0 Total Non-Current Assets -52,027.1 -36,075.8 -33,663.8 -19,537.1 -13,161.7 - 14,192.9 -13,531.9 Net Debt 25,489.2 38,726.3 47,127.1 91,685.5 69,885.3 Net Assets 38,726.3 69,885.3 47,127.1 25,489.2 91,685.5 Total Equity 0.42 0.24 0.54 0.87 0.91 Working Capital to Sales 4.75 5.77 9.36 10.35 8.88 Net Fixed Asset Turnover Accounts Payable Turnover Days 4.12 6.45 10.20 8.51 Days Sales Outstanding - DSO 0.98 Inventory Days 1.55 1.61 3.18 2.22 1.04 Cash Ratio 1.60 1.66 2.25 3.20 1.30 Quick Ratio 1.89 1.94 3.58 2.58 21.82 Current Ratio 28.57 28.30 23.12 33.27 Total Debt to Total Equity Save All Answers 11 Save and Close Window Fck Save and Submit to save and submit. Click Save All Answers to save all answers. MacBook Pro -36,075.8 -52,027.1 18,273.8 -14,192.9 25,489.2 25,489.2 0.87 10.35 35,702.9 -13,531.9 38,726.3 38,726.3 0.91 8.88 47,247.3 -13,161.7 47,127.1 47,127.1 0.54 9.36 73,198.0 -19,537.1 69,885.3 69,885.3 0.42 5.77 103,515.0 -33,663.8 91,685.5 91,685.5 0.24 4.75 4.12 6.45 8.51 10.20 2.22 Total Non-Current Assets Net Debt Net Assets Total Equity Working Capital to Sales Net Fixed Asset Turnover Accounts Payable Turnover Days Days Sales Outstanding - DSO Inventory Days Cash Ratio Quick Ratio Current Ratio Total Debt to Total Equity Net Interest Coverage Cash From Operations Cash from Investing Activities Cash from Financing Activities Dividends Paid Capital Expenditures CFO to Sales 0.98 1.04 3.18 3.20 3.58 33.27 2.25 2.58 23.12 1.61 1.66 1.94 28.30 6,653.9 -8,629.3 14,107.0 -16.8 -1,243.9 54.09 0.78 68.72 30.36 31.84 -7,464.2 1.55 1.60 1.89 28.57 22.95 19.014.1 -12,660.0 2,160.4 0.0 -4,509.4 50.27 1.00 57.23 27.70 25.61 8,940.4 -6,737.4 -2,419.3 0.0 -1,705.9 56.19 0.98 66.03 28.77 70.65 -8,806.5 21.82 21.45 22,500.6 -22,513.3 -618.0 0.0 -7,398.6 40.06 1.12 45.09 11,942.5 -11,650.8 5,197.1 0.0 -2,608.7 50.75 0.88 62.42 30.36 27.59 18.80 Gross Margin Operating Margin Profit Margin 19.35 23.62 23.32 25.76 T T TT Paragraph Arial * Dogo Os Mashups - - ? 3 (12pt) TT, - E-T- - 's T - -- BOBO HTHLESS Save All Answer Click Save and Submit to save and submit. Click Save All Answers to save all answers. Save Answer QUESTION 26 40 points The tables below display some of the key financial ratios calculated for Alibaba Group Holding Ltd during the period 2015-2019. Discuss the ROE Decomposition of the company and evaluate the drivers of its performance during this period. What trends can you identity in the company's performance? What do you believe will be the effect of the current crisis on the company's financial statements? Alibaba Group Holding Ltd (BABA US) In Millions of USD except Per Share FY 2015 FY 2016 FY 2017 FY 2018 FY 2019 FY 2020 Est FY 2021 Est 12 Months Ending 03/31/2015 03/31/2016 03/31/2017 03/31/2018 03/31/2019 03/31/2020 03/31/2021 Profit Margin 31.84 70.65 27.59 25.61 23.32 25.76 23.62 Asset Turnover 0.42 0.33 0.36 0.41 0.45 Financial Leverage 2.10 1.71 1.76 1.90 1.96 27.76 39.43 19.89 17.62 20.48 Return on Common Equity 21.67 17.35 19.85 10.37 22.95 18.13 Effective Tax Rate 17.20 539.0 773.5 Net Interest Expense 15,909.9 23,531.3 12,302.0 37,825.0 71,086.2 56,163.1 93,132.3 Revenue 3,830.9 2,736.8 4,757.6 5,434.7 7,128.3 Net Operating Profit after Tax (NOPAT) 16,518.1 12,712.7 12,838.8 19,250.2 9,327.0 Working Capital 18,273.8 35,702.9 47,247.3 73,198.0 103,515.0 Total Non-Current Assets -52,027.1 -36,075.8 -33,663.8 -19,537.1 -13,161.7 - 14,192.9 -13,531.9 Net Debt 25,489.2 38,726.3 47,127.1 91,685.5 69,885.3 Net Assets 38,726.3 69,885.3 47,127.1 25,489.2 91,685.5 Total Equity 0.42 0.24 0.54 0.87 0.91 Working Capital to Sales 4.75 5.77 9.36 10.35 8.88 Net Fixed Asset Turnover Accounts Payable Turnover Days 4.12 6.45 10.20 8.51 Days Sales Outstanding - DSO 0.98 Inventory Days 1.55 1.61 3.18 2.22 1.04 Cash Ratio 1.60 1.66 2.25 3.20 1.30 Quick Ratio 1.89 1.94 3.58 2.58 21.82 Current Ratio 28.57 28.30 23.12 33.27 Total Debt to Total Equity Save All Answers 11 Save and Close Window Fck Save and Submit to save and submit. Click Save All Answers to save all answers. MacBook Pro -36,075.8 -52,027.1 18,273.8 -14,192.9 25,489.2 25,489.2 0.87 10.35 35,702.9 -13,531.9 38,726.3 38,726.3 0.91 8.88 47,247.3 -13,161.7 47,127.1 47,127.1 0.54 9.36 73,198.0 -19,537.1 69,885.3 69,885.3 0.42 5.77 103,515.0 -33,663.8 91,685.5 91,685.5 0.24 4.75 4.12 6.45 8.51 10.20 2.22 Total Non-Current Assets Net Debt Net Assets Total Equity Working Capital to Sales Net Fixed Asset Turnover Accounts Payable Turnover Days Days Sales Outstanding - DSO Inventory Days Cash Ratio Quick Ratio Current Ratio Total Debt to Total Equity Net Interest Coverage Cash From Operations Cash from Investing Activities Cash from Financing Activities Dividends Paid Capital Expenditures CFO to Sales 0.98 1.04 3.18 3.20 3.58 33.27 2.25 2.58 23.12 1.61 1.66 1.94 28.30 6,653.9 -8,629.3 14,107.0 -16.8 -1,243.9 54.09 0.78 68.72 30.36 31.84 -7,464.2 1.55 1.60 1.89 28.57 22.95 19.014.1 -12,660.0 2,160.4 0.0 -4,509.4 50.27 1.00 57.23 27.70 25.61 8,940.4 -6,737.4 -2,419.3 0.0 -1,705.9 56.19 0.98 66.03 28.77 70.65 -8,806.5 21.82 21.45 22,500.6 -22,513.3 -618.0 0.0 -7,398.6 40.06 1.12 45.09 11,942.5 -11,650.8 5,197.1 0.0 -2,608.7 50.75 0.88 62.42 30.36 27.59 18.80 Gross Margin Operating Margin Profit Margin 19.35 23.62 23.32 25.76 T T TT Paragraph Arial * Dogo Os Mashups - - ? 3 (12pt) TT, - E-T- - 's T - -- BOBO HTHLESS Save All Answer Click Save and Submit to save and submit. Click Save All Answers to save all answers
Step by Step Solution
There are 3 Steps involved in it

Get step-by-step solutions from verified subject matter experts