

Question: arrow) week) (arrows per week) $140 0 $90 20 30 $60 40 40 $30 60 50 $0 80 60 Using the point plotting tool,
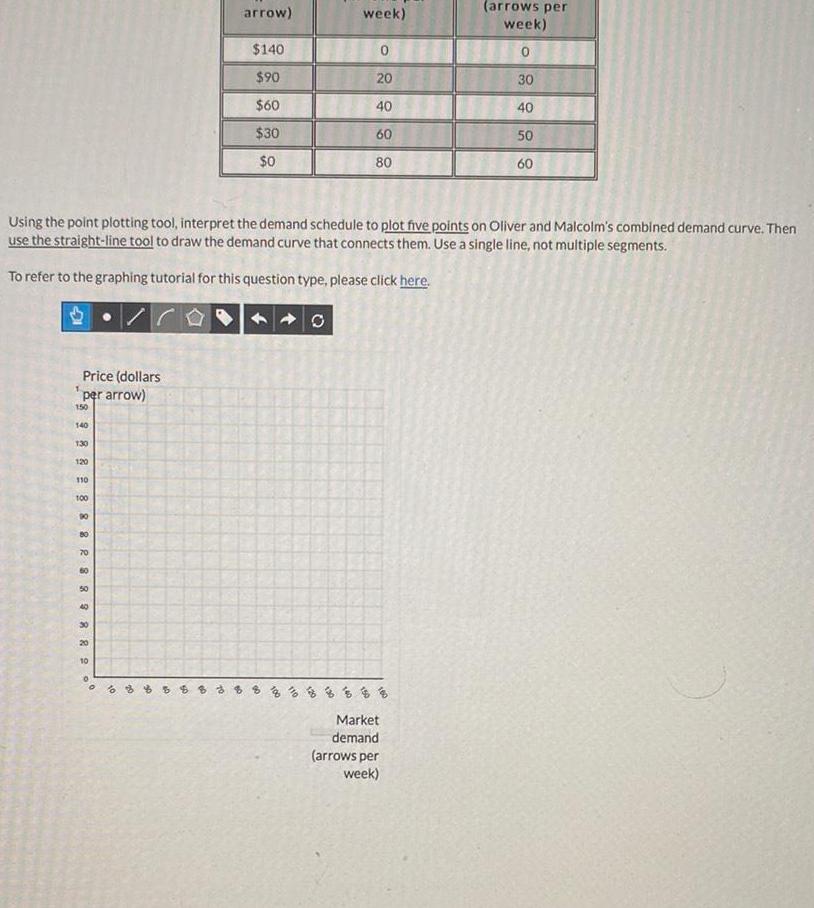
arrow) week) (arrows per week) $140 0 $90 20 30 $60 40 40 $30 60 50 $0 80 60 Using the point plotting tool, interpret the demand schedule to plot five points on Oliver and Malcolm's combined demand curve. Then use the straight-line tool to draw the demand curve that connects them. Use a single line, not multiple segments. To refer to the graphing tutorial for this question type, please click here. 150 Price (dollars per arrow) 140 130 120 110 100 90 80 70 60 50 40 30 20 10 20 O Market demand (arrows per week)
Step by Step Solution
There are 3 Steps involved in it
1 Expert Approved Answer
Step: 1 Unlock

Question Has Been Solved by an Expert!
Get step-by-step solutions from verified subject matter experts
Step: 2 Unlock
Step: 3 Unlock