

Question: art A: Measuring Atomic Emission Spectra 1. Plot the emission spectra (intensity vs. wavelength) for hydrogen. Attach and submit the graph in the space below
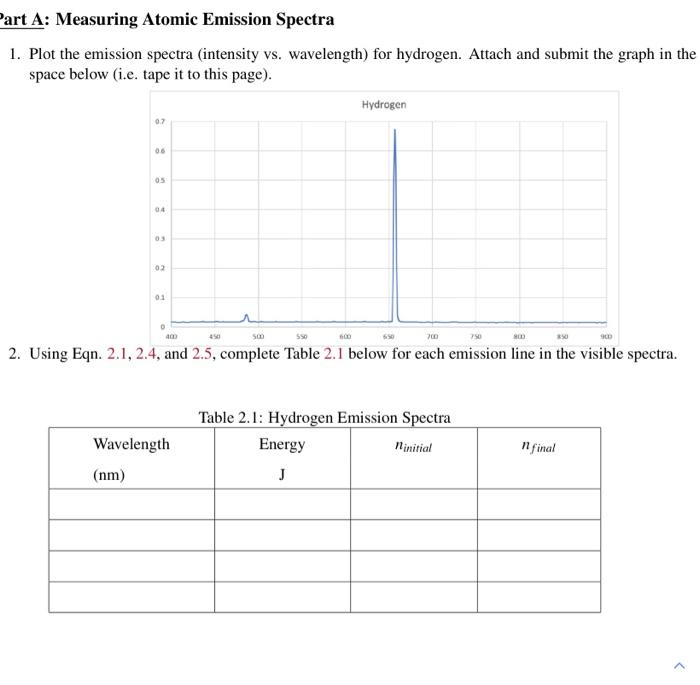
art A: Measuring Atomic Emission Spectra 1. Plot the emission spectra (intensity vs. wavelength) for hydrogen. Attach and submit the graph in the space below (i.e. tape it to this page). 2. Using Eqn. 2.1, L.4, and L.J, compete sabie 2.1 below Ior eacn emission une in the visibie spectra. art A: Measuring Atomic Emission Spectra 1. Plot the emission spectra (intensity vs. wavelength) for hydrogen. Attach and submit the graph in the space below (i.e. tape it to this page). 2. Using Eqn. 2.1, L.4, and L.J, compete sabie 2.1 below Ior eacn emission une in the visibie spectra
Step by Step Solution
There are 3 Steps involved in it
1 Expert Approved Answer
Step: 1 Unlock

Question Has Been Solved by an Expert!
Get step-by-step solutions from verified subject matter experts
Step: 2 Unlock
Step: 3 Unlock