

Question: arts for Variables Problem 2 Construct both Mean and Range chart from the following data. Is the process under control? Sample number Sample mean Sample
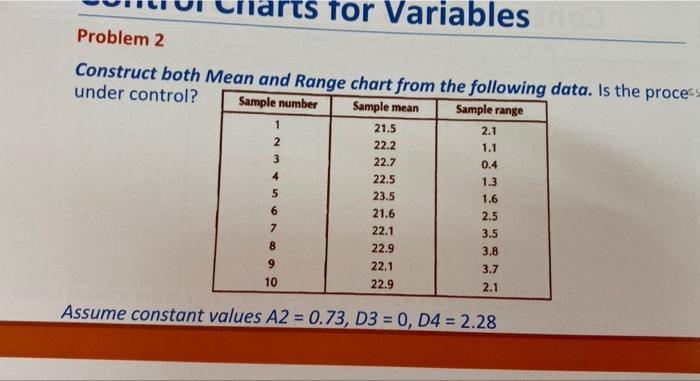
arts for Variables Problem 2 Construct both Mean and Range chart from the following data. Is the process under control? Sample number Sample mean Sample range 1 2 3 4 5 6 21.5 22.2 22.7 22.5 23.5 21.6 22.1 22.9 22.1 22.9 2.1 1.1 0.4 1.3 1.6 2.5 3.5 3.8 3.7 2.1 7 8 9 10 Assume constant values A2 = 0.73, D3 = 0, D4 = 2.28
Step by Step Solution
There are 3 Steps involved in it
1 Expert Approved Answer
Step: 1 Unlock

Question Has Been Solved by an Expert!
Get step-by-step solutions from verified subject matter experts
Step: 2 Unlock
Step: 3 Unlock